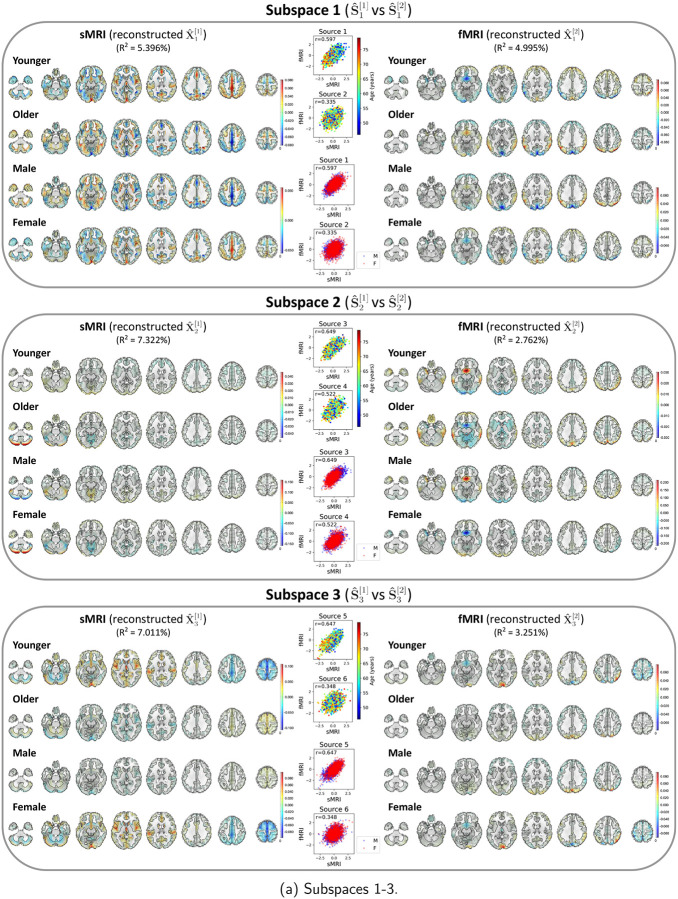
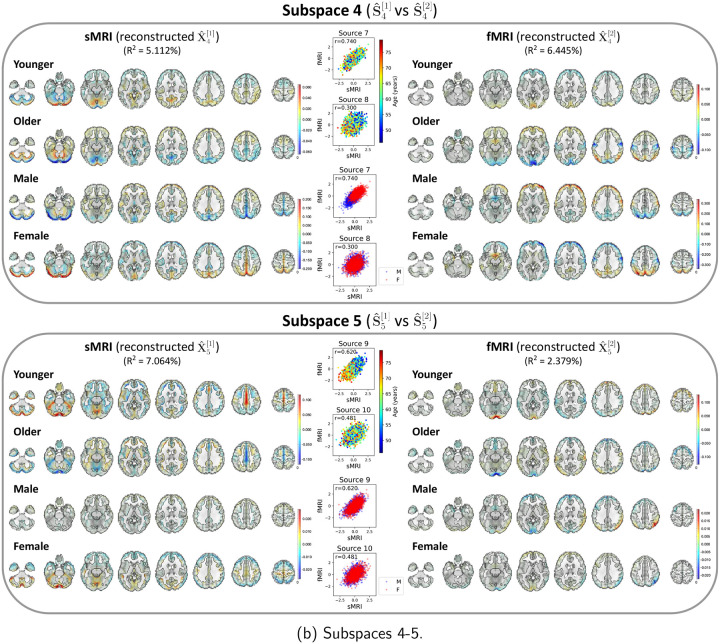
Figure 16: UKB neuroimaging data: Spatial maps of group-specific reconstructed data from MSIVA sources related to age and sex effects.
Axial slices show the geometric median of the reconstructed data () for each modality (sMRI or fMRI) and each group (younger: 46 – 63 years, older: 63 – 79 years; male or female). Voxel intensity is mapped to both color hue and opacity. The contours highlight the brain areas where voxelwise cross-modal correlations are significant for each group (, Bonferroni correction for 44318 voxels). Scatter plots show post-CCA sources color-coded by age or sex. The reported indicates the proportion of variance captured by the subspace in each modality.


