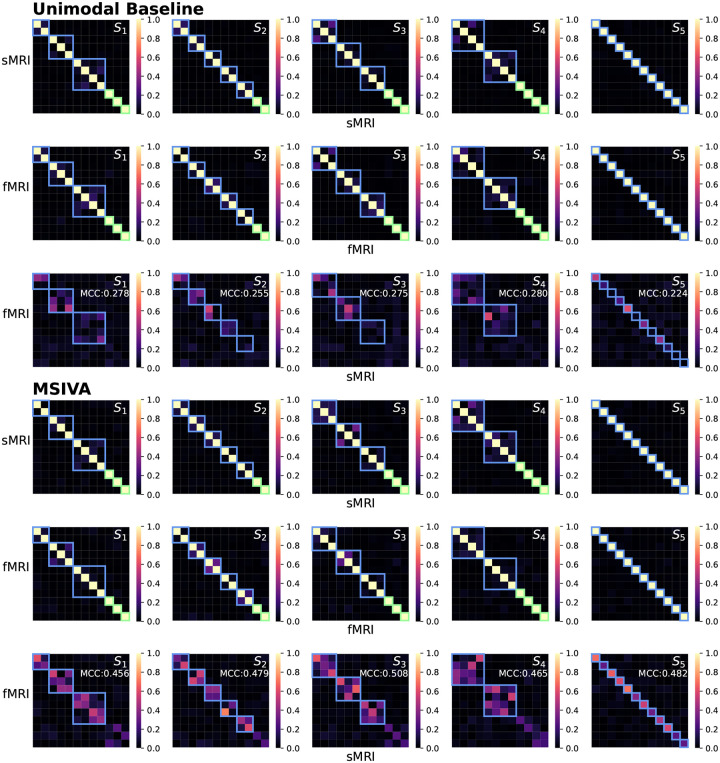
Figure 5: UKB neuroimaging data: Within-modal Pearson correlations (rows I-II and IV-V) and cross-modal Pearson correlations (rows III and VI) of the recovered sources before applying post-hoc CCA.
Cross-modal subspaces are highlighted in blue while unimodal subspaces are highlighted in green. Within-modal self-correlation patterns indicate negligible residual dependence between subspaces (rows I-II and IV-V). MSIVA shows stronger cross-modal correlations (higher MCCs) than the unimodal baseline for all predefined subspace structures (row VI vs row III).

