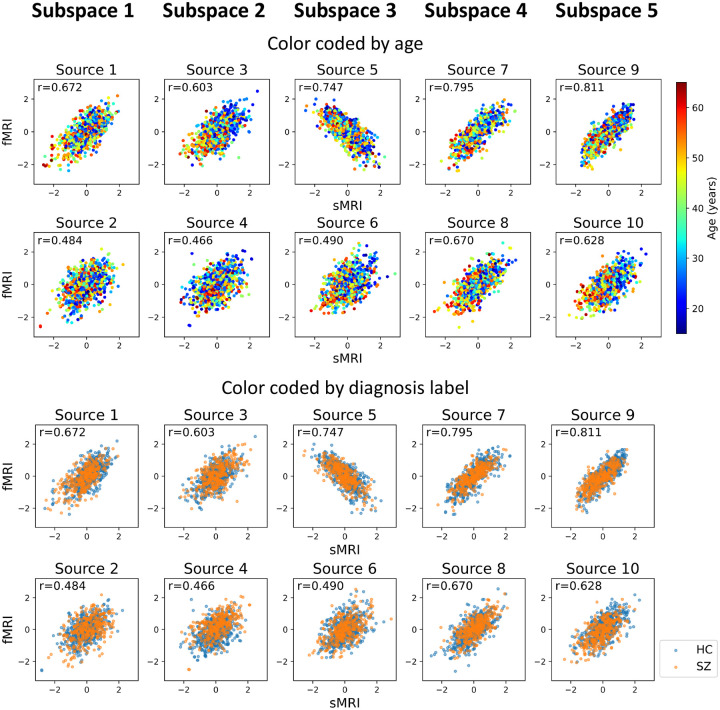
Figure 8: Patient neuroimaging data: Post-CCA sources from MSIVA cross-modal subspaces, color coded by age and diagnosis labels.
Rows I and II show the age effect, while rows III and IV show the SZ effect. In particular, subspaces 2 and 5 are associated with the age- (especially cross-modal source 3 in subspace 2 and sources 9 and 10 in subspace 5) and SZ-related effects (especially cross-modal source 4 in subspace 2 and sources in subspace 5).

