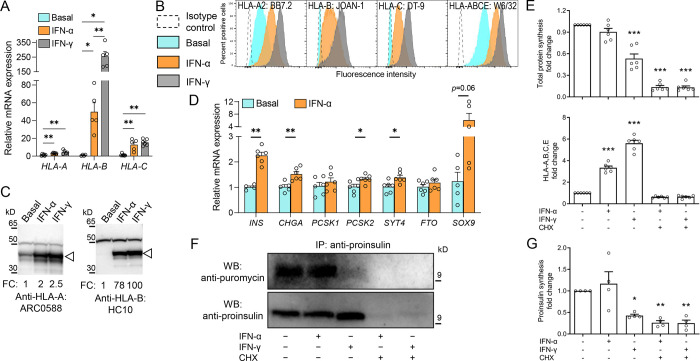
Figure 4. IFN-α preferentially upregulates HLA-B expression without inducing dedifferentiation or reducing proINS synthesis.
A. Relative mRNA expression of HLA-A, HLA-B and HLA-C alleles in ECN90 β-cells exposed or not to IFN-α or IFN-γ for 24 h. GAPDH was used as an internal normalizing control, and each gene was normalized to the basal sample. Data represent mean±SEM of 5 biological replicates. **p<0.01 and *p<0.05 by Mann-Whitney U test. B-C. Protein expression of HLA-A, -B and -C in in ECN90 β-cells exposed or not to IFN-α or IFN-γ, as detected by surface flow cytometry (B) and Western blot (C) using the indicated Abs validated for their specificity (see Supplementary Fig. 5). For Western blotting, the arrowhead indicates the HLA-I heavy chain band, with the top band indicating the α-tubulin loading control and normalized HLA-I fold change (FC) values indicated. D. Relative mRNA expression of β-cell identity genes in ECN90 β-cells exposed or not to IFN-α. PPIA was used as internal normalizing control, and data representation is the same as in panel A. **p<0.01 and *p<0.05 by Mann-Whitney U test. E. Puromycin incorporation in newly synthesized total proteins (top) and HLA-A/B/C/E expression (bottom), detected by flow cytometry and expressed as fold change compared to the basal sample (first column). Inhibition of protein synthesis by cycloheximide (CHX) provided negative controls (last 2 columns). Data represent mean±SEM of 6 biological replicates. ***p<0.0001 by one-way ANOVA. F. Puromycin incorporation in newly synthesized proINS, detected by proINS immunoprecipitation followed by Western blot for puromycin (top; corresponding to newly synthesized proINS) and proINS (bottom; corresponding to total proINS). A representative experiment out of 4 performed is shown. G. Puromycin incorporation in newly synthesized proINS, detected by Western blot and expressed as fold change compared to the basal sample (first column). Data represent mean±SEM of 4 biological replicates. *p<0.03 and **p<0.002 by one-way ANOVA.

