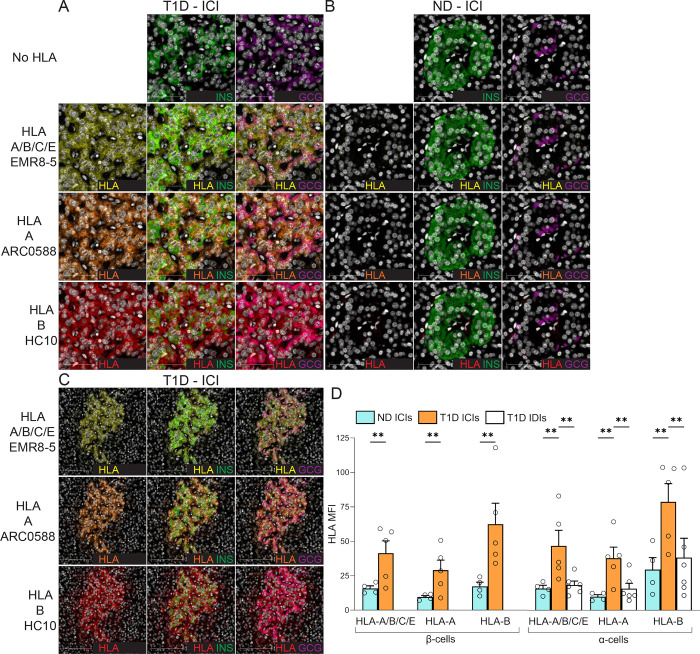
Figure 5. HLA-B vs. HLA-A hyper-expression in the islets of T1D and non-diabetic (ND) cases.
A-B. Representative immunofluorescence images of ICIs from T1D case nPOD 6396 (A) and ND case nPOD 6160 (B; all cases listed in Supplementary Table 1), stained with DAPI only (first row) or for HLA-A/B/C/E (yellow; second row), HLA-A (orange; third row) and HLA-B (red, fourth row), alone (first column) or in combination with INS (green, second column) or GCG (violet, third column). Scale bar 50 μm. C. Whole ICI images from the same T1D case nPOD 6396, scale bar 100 μm. D. Immunofluorescence quantification of HLA-I mean fluorescence intensity (MFI) for HLA-A/B/C/E, HLA-A and HLA-B in β-cells (left) and α-cells (right) from ICIs of ND (blue; n=4) and T1D cases (orange; n=5); and in α-cells from IDIs of T1D cases (white; n=6). Bars represent mean+SEM values. **p≤0.005 by 2-way ANOVA. T1D IDI images and individual quantifications for each T1D donor are provided in Supplementary Fig. 6.

