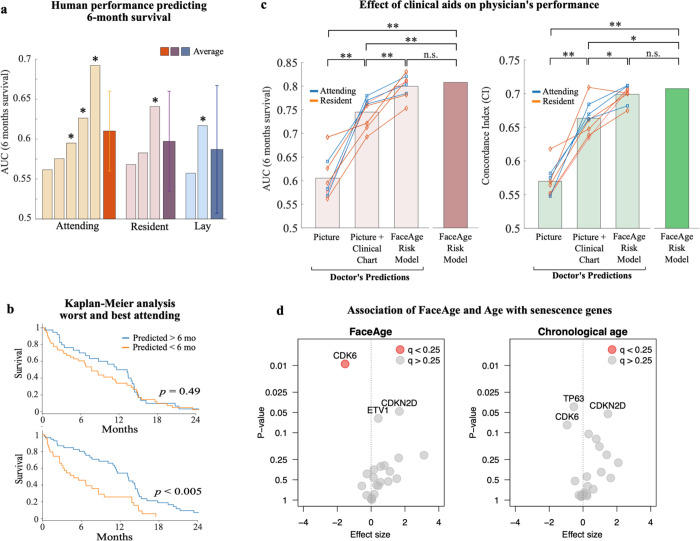
Fig. 4. Comparison of human and FaceAge performance predicting survival.
a) Area under curve (AUC) of the receiver operating characteristic for 6-month survival predicted for 10 survey takers, grouped by experience level (*: AUC significantly different from random). Confidence intervals are shown for average AUCs. b) Kaplan-Meier analysis of overall survival of patients predicted to be either alive at 6 months or not, comparing lowest (top) and highest (bottom) performers of the attending physicians. c) Six-month survival prediction (left) and overall survival time (right) for physicians (both attending and residents) aided with only a picture, a picture + clinical chart information, and a risk model including clinical data and FaceAge. (two-sided Wilcoxon signed rank test; *: p<0.05; **: p<0.01; n.s.: non-significant). The survey included 100 palliative patients randomly selected from the Harvard-Palliative cohort. d) Results of the Burden test for the association of the senescence genes with FaceAge or chronological age. After adjusting for multiple comparisons using a false discovery rate (q) of 0.25, only CDK6 was statistically significant for FaceAge, while none of the other genes were statistically significant for either FaceAge or chronological age.

