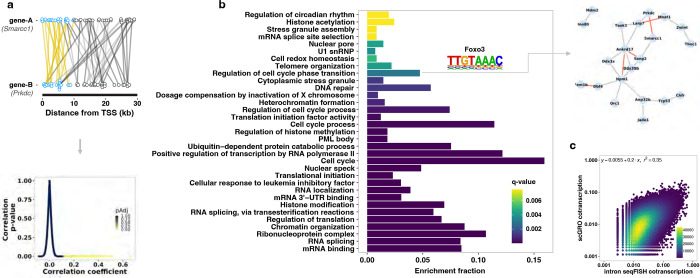
Fig. 4 |. Coordinated transcription of functionally related genes.
a, A pair of co-transcribed genes (top). Reads within the first 10 kb of the gene pair (blue circle) expressed in the same cells are connected by a yellow line. Reads beyond the first 10 kb (gray circles and lines) are not used in gene-gene correlation. Pair-wise Pearson correlation was calculated from a binarized genes by cells matrix. The relationship between the Pearson correlation coefficient, uncorrected p-value, and the false discovery rate corrected p-value for pairwise gene-gene correlation is shown (bottom). b, Gene ontology terms enriched in co-transcribed gene modules. The transcription factor motif enriched in the promoters of the genes associated with the GO term and the co-transcribed genes that contributed to the enrichment of the GO term is shown as an example on the right (red line indicating rho > 0.15). A complete list of GO terms and the co-transcribed genes contributing to the enrichment of the GO terms is provided in Table 5. c, Correlation of co-transcription of significantly co-transcribed gene pairs (n = 164,380) between scGRO-seq and intron seqFISH. Axes represent the fraction of cells in which a gene pair is co-transcribed.

