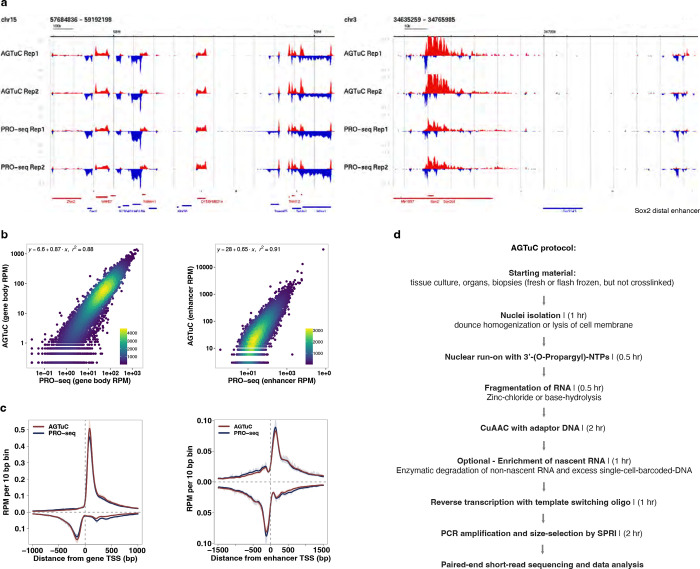
Extended Data Fig. 2 |. Comparison between AGTuC and PRO-seq.
a, Representative genome-browser screenshots with two replicates of AGTuC and PRO-seq showing a region in chromosome 15 (left) and a region in chromosome 3 containing the Sox2 gene and its distal enhancer (right) of the mouse genome (mm10). b, Correlation between AGTuC and PRO-seq reads per million sequences in gene bodies (left, n = 19,961) and enhancers (right, n = 12,542). c, Metagene profiles of AGTuC and PRO-seq reads per million per 10 base pair bins around the TSS of genes (left, n = 19,961) and enhancers (right, n = 12,542). The line represents the mean, and the shaded region represents 95% confidence interval. d, Major steps with the approximate time required in AGTuC library preparation.

