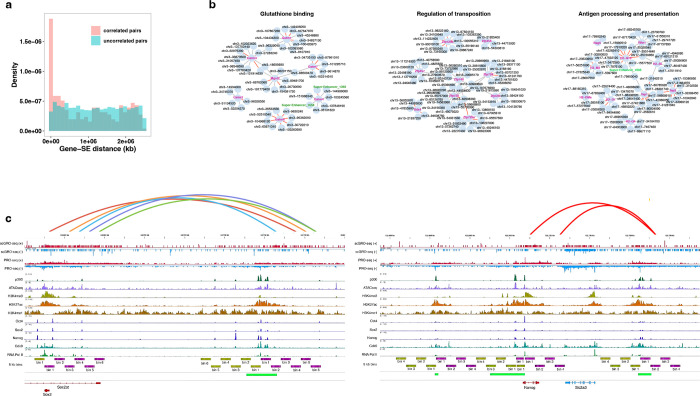
Extended Data Fig. 10 |. Organization of enhancer-gene co-transcription networks.
a, Distance between correlated and non-correlated SE-gene pairs within 2.5 Mb of each other. b, Co-transcription network of functionally related genes clustered together on the same chromosome shown as examples. Red edges between the enhancer-gene pairs indicate rho > 0.15, and rho > 0.1 and < 0.15 are shown in gray. c, Co-transcription between the Sox2 gene and its distal enhancer (left), and the Nanog gene and its three enhancers (right). Green bars represent the annotated SE regions, and the 5 kb bins in sense and antisense strands are represented in magenta and yellow-green bars.

