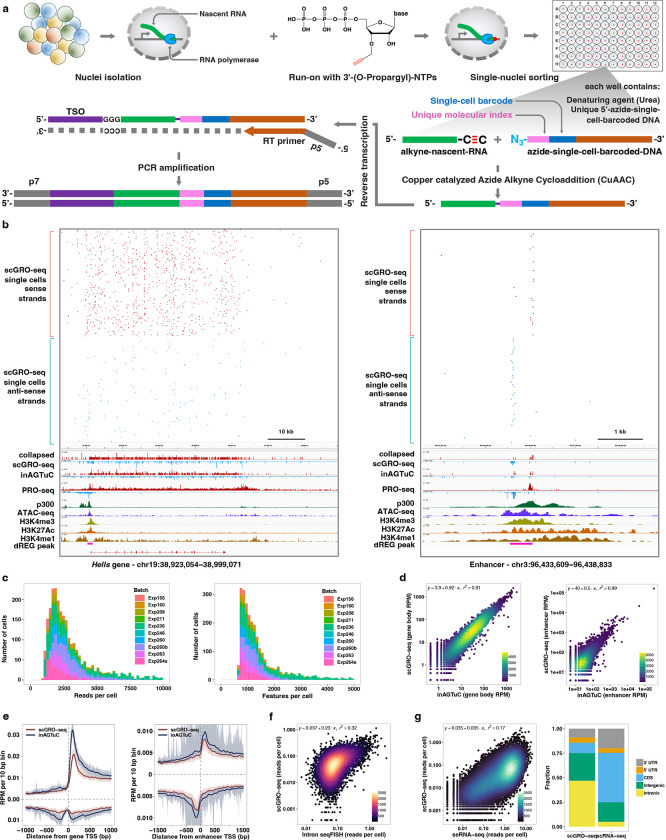
Fig. 1 |. Single-cell nascent RNA sequencing depicts genome-wide nascent transcription.
a, A summary of scGRO-seq workflow. b, Representative genome-browser screenshots showing scGRO-seq reads at a single-cell resolution, the aggregate scGRO-seq level, inAGTuC, PRO-seq, and chromatin marks around a gene (left) and an enhancer (right). c, Distribution of scGRO-seq reads per cell (left) and features per cell (right). d, Correlation between aggregate scGRO-seq and inAGTuC reads per million sequences in the body of genes (left, n = 19,961) and enhancers (right, n = 12,542). e, Metagene profiles of scGRO-seq compared with inAGTuC reads per million per 10 base pair bins around the TSS of genes (left, n = 19,961) and enhancers (right, n = 12,542). The line represents the mean, and the shaded region represents the 95% confidence interval. f, Correlation between scGRO-seq and intron seqFISH reads per cell in the body of genes used in intron seqFISH (n = 9,666). g, Correlation between scGRO-seq and scRNA-seq reads per cell in the body of genes (left, n = 19,961) and the distribution of reads in various genomic regions (right).

