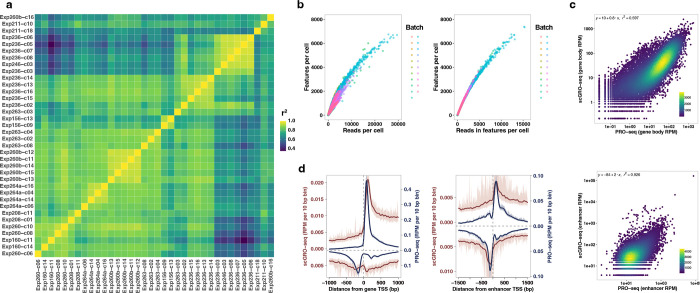
Extended Data Fig. 7 |. Benchmarking scGRO-seq.
a, Coefficient of determination (r2) between each 96-well plate from scGRO-seq batches that passed the quality-control threshold. r2 was calculated from average reads per 96 cells in all genes and enhancers. b, Relationship between the number of features detected per cell and the scGRO-seq reads per cell (left), or scGRO-seq reads in features per cell (right). c, Correlation between scGRO-seq and PRO-seq reads per million sequences in gene bodies (top, n = 19,961) and enhancers (bottom, n = 12,542). d, Comparison of metagene profiles between scGRO-seq and PRO-seq reads per million per 10 base pair bins around the TSS of genes (left, n = 19,961) and enhancers (right, n = 12,542).

