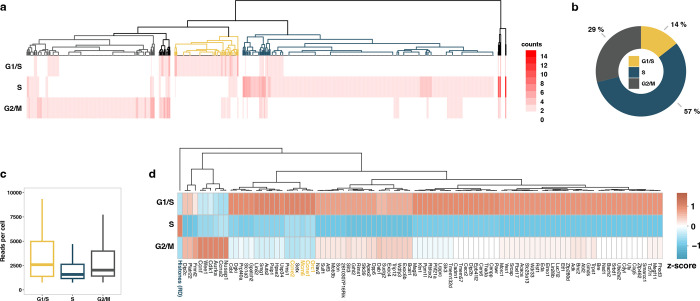
Fig. 3 |. Cell-cycle inference by non-polyadenylated replication-dependent histone genes expression.
a, Heatmap of hierarchical clustering of single cells representing transcription of G1/S, S, and G2/M specific genes. The dendrogram colors represent cell clusters with cell-cycle phase-specific gene transcription. b, Fraction of cells in the three primary clusters distinguished by transcription of G1/S, S, and G2/M specific genes. c, Distribution of scGRO-seq reads per cell in the three clusters of cells defined by cell-cycle phase-specific gene transcription. d, Differentially expressed genes among the three clusters of cells defined by transcription of G1/S, S, and G2/M specific genes. The genes used to classify cells are denoted in bold and colored. Histones (RD) represent aggregate reads from replication-dependent histone genes.

