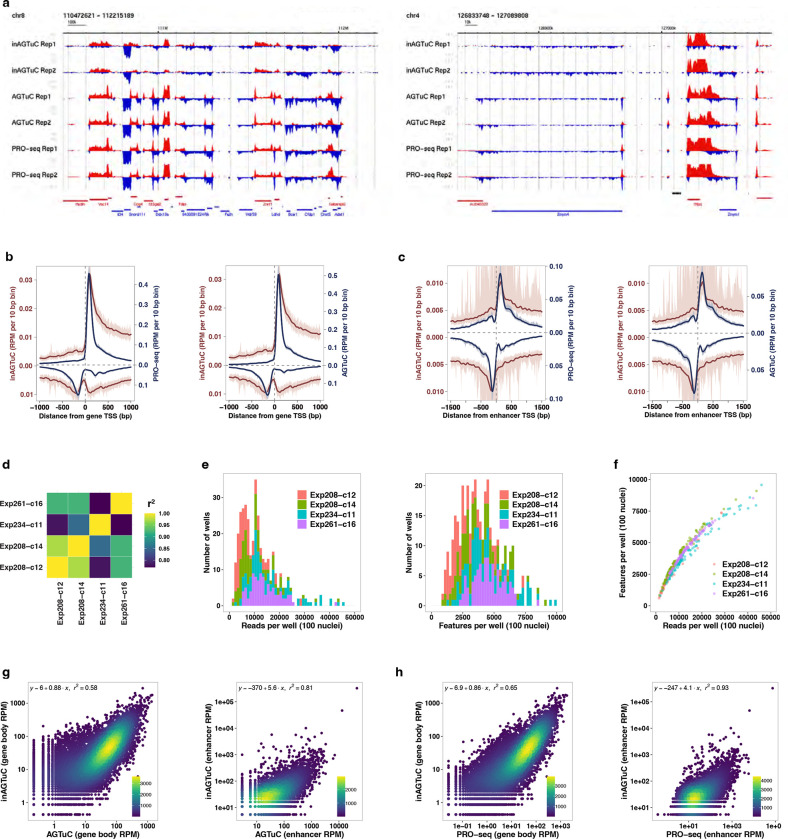
Extended Data Fig. 4 |. Benchmarking inAGTuc against AGTuC and PRO-seq.
a, Representative genome-browser screenshots with two replicates of inAGTuC, AGTuC, and PRO-seq showing a region in chromosome 8 (left) and a region in chromosome 4 of the mouse genome (mm10). b, c, Comparison of inAGTuC metagene profiles with PRO-seq and AGTuC using reads per million per 10 base pair bins around (b) the TSS of genes (n = 19,961) and (c) enhancers (n = 12,542). The line represents the mean, and the shaded region represents 95% confidence interval. d, Correlations of inAGTuC reads per million sequences in gene bodies (n = 19,961) between the four replicates. e, Distribution of reads per well (left) and features per well (right) in four replicates of 96-well plate inAGTuC libraries. Each well contains 100 nuclei. f, Relationship between the reads per well and the number of features detected per well in four replicates of 96-well plate inAGTuC libraries. g, h, Correlation between inAGTuC and AGTuC (two left panels) or PRO-seq (two right panels) reads per million sequences in (g) the body of genes (n = 19,961) and (h) enhancers (n = 12,542).

