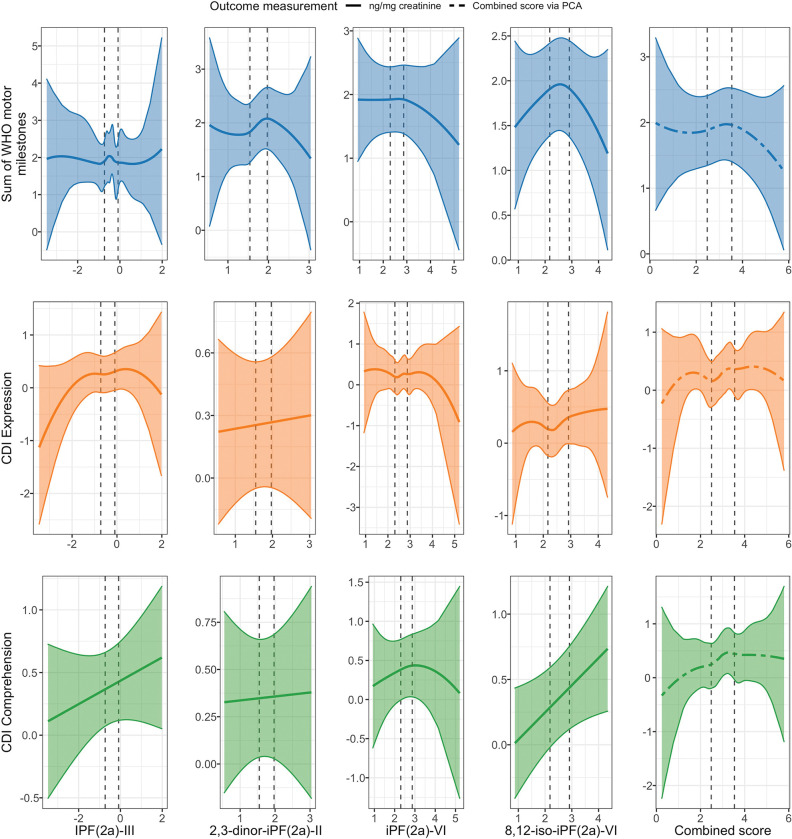
Figure 5. Spline curves of the associations between concurrent urinary F2 isoprostanes and child development at Year 1.
CDI: MacArthur-Bates Communicative Development Inventories. Spline curves demonstrating the associations between measures of urinary isoprostanes and concurrent child development. Dotted, vertical lines represent the 25th and 75th percentiles of urinary isoprostane distributions.

