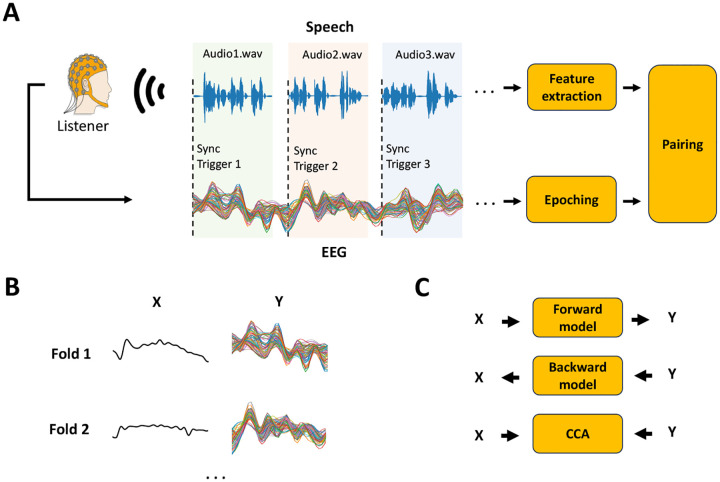
FIGURE 3. Continuous sensory experiment data acquisition and analysis.
The figure focuses on a typical continuous speech listening scenario, where X represents the stimulus feature of interest and Y the preprocessed neural signal. (A) EEG/MEG is recorded as the participant listens to speech segments. Synchronisation triggers are used to epoch data into trials of continuous speech, in contrast to being used to epoch data around discrete stimulus tokens. The value of each trigger corresponds to the index of the audio file (e.g., 1: audio1.wav, 2: audio2.wav). Stimulus features (e.g., sound envelope) are extracted for every audio-file and paired with each corresponding EEG/MEG epoch. (B) Neural data and stimulus feature pairs are organised into data structures, X and Y, that are time synchronized. Trials of continuous responses can be used as the folds for a leave-one-fold-out cross-validation. (C) X and Y can be used to investigate the EEG/MEG encoding of the stimulus features of interest using a forward model (TRF) [37] approach. Conversely, X and Y can be used to build decoding or backward models [38]. While mTRF-based forward and backward models are limited to multivariate-to-univariate mappings, relationships where both X and Y are multivariate can be studied with methods like canonical-correlation analysis (CCA) [31].

