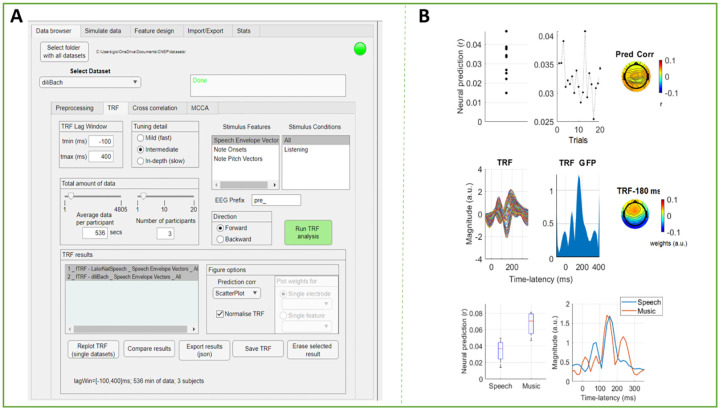
FIGURE 6. The Cognition and Natural Sensory Processing (CNSP) Data Browser.
(A) Screenshot of the Data Browser (left). There are five tabs coresponding to experimental analysis steps (data browser, stimulate data, feature design, import/export, and stats). Under the ‘Data Browser’ tab, the drop down menu permits dataset selection. There are four tabs corresponding to data browser settings (preprocessing, TRF, cross-correlation, MCCA). Under these settings, a user can select a specific band-pass filtering bandwidth, downsampling ratio, and TRF model hyperparameter values. There are also tabs for feature selection, data exporting, and statistical testing. (B) The GUI can visualize results across datasets or parameter configurations. The plots in the top and middle panels are the typical visualisations for forward TRF models. The top panels show, from left to right, the EEG prediction correlations for each participant (average across channels and trials), for each trial (average across channels and participants), and for each EEG channel (average across participants and trials). The middle panels show the TRF weights of a speech envelope TRF model for each channel (average across participants), the Global Field Power of the TRF weight (GFP), and the topography of the TRF weights at the peak latency of the GFP. The bottom plots compare speech and music TRFs from different datasets in terms of EEG prediction correlations and GFP.

