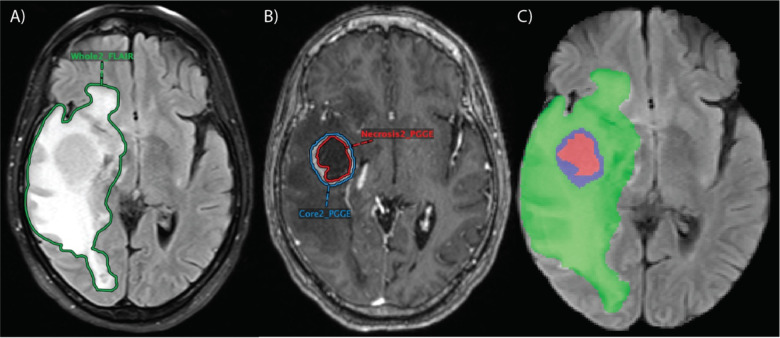
Fig 2.
Segmentations performed in research PACS for one patient. FLAIR (A) included segmentation of whole tumor (“Whole2_FLAIR”), including peritumoral edema, and T1 post-contrast (B) included segmentations of the contrast-enhancing lesion (“Core2_PGGE”) and necrotic portions within the contrast-enhancing lesion (“Necrosis2_PGGE”). (C) Combined segmentation mask overlaid on FLAIR sequence in NIfTI format with the green region representing peritumoral edema, the blue region representing contrast-enhancing tumor, and the red region representing necrotic tumor.

