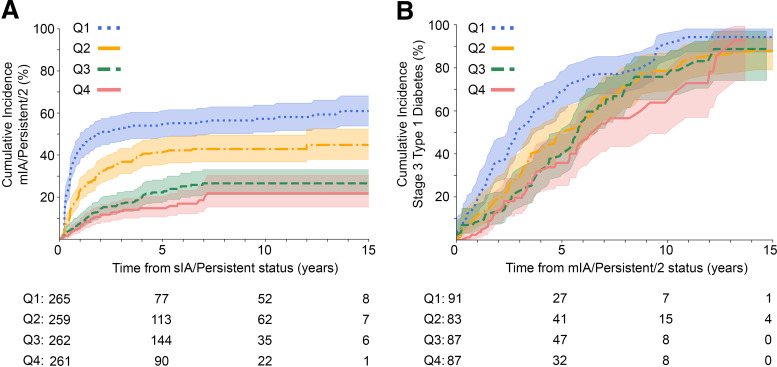
Figure 2.
Impact of age on progression. A: Cumulative incidence of mIA/Persistent/2 stratified by age quartile (Q) at sIA/Persistent status (n = 1,047). B: Cumulative incidence of stage 3 type 1 diabetes stratified by age quartile at mIA/Persistent/2 status (n = 819). Age quartile intervals for both A and B are as follows: Q1 (0.0, 2.0), Q2 (2.0, 3.5), Q3 (3.5, 7.1), Q4 (7.1, 18.7); (parentheses indicate participant are older than lower age boundary, bracket indicates age quartile is inclusive of upper boundary age). P < 0.005 by multivariate log-rank test for both A and B. The shaded areas show the 95% CI. Pairwise comparisons are in Supplementary Tables 3 and 4, respectively.

