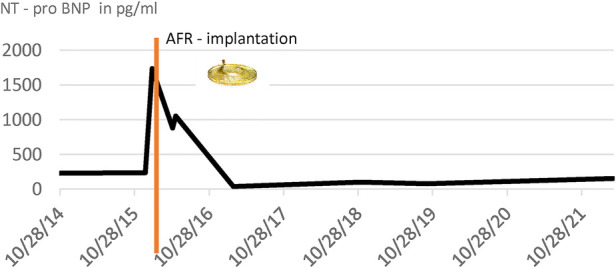
Table 2.
NT-pro BNP values before and after AFR implantation.

|
Elevated NT – pro BNP levels at the time of implantation, Red line: time of AFR – Implantation, normalization of NT – pro BNP levels after implantation, and maintaining levels within a normal range over a long-term period.
