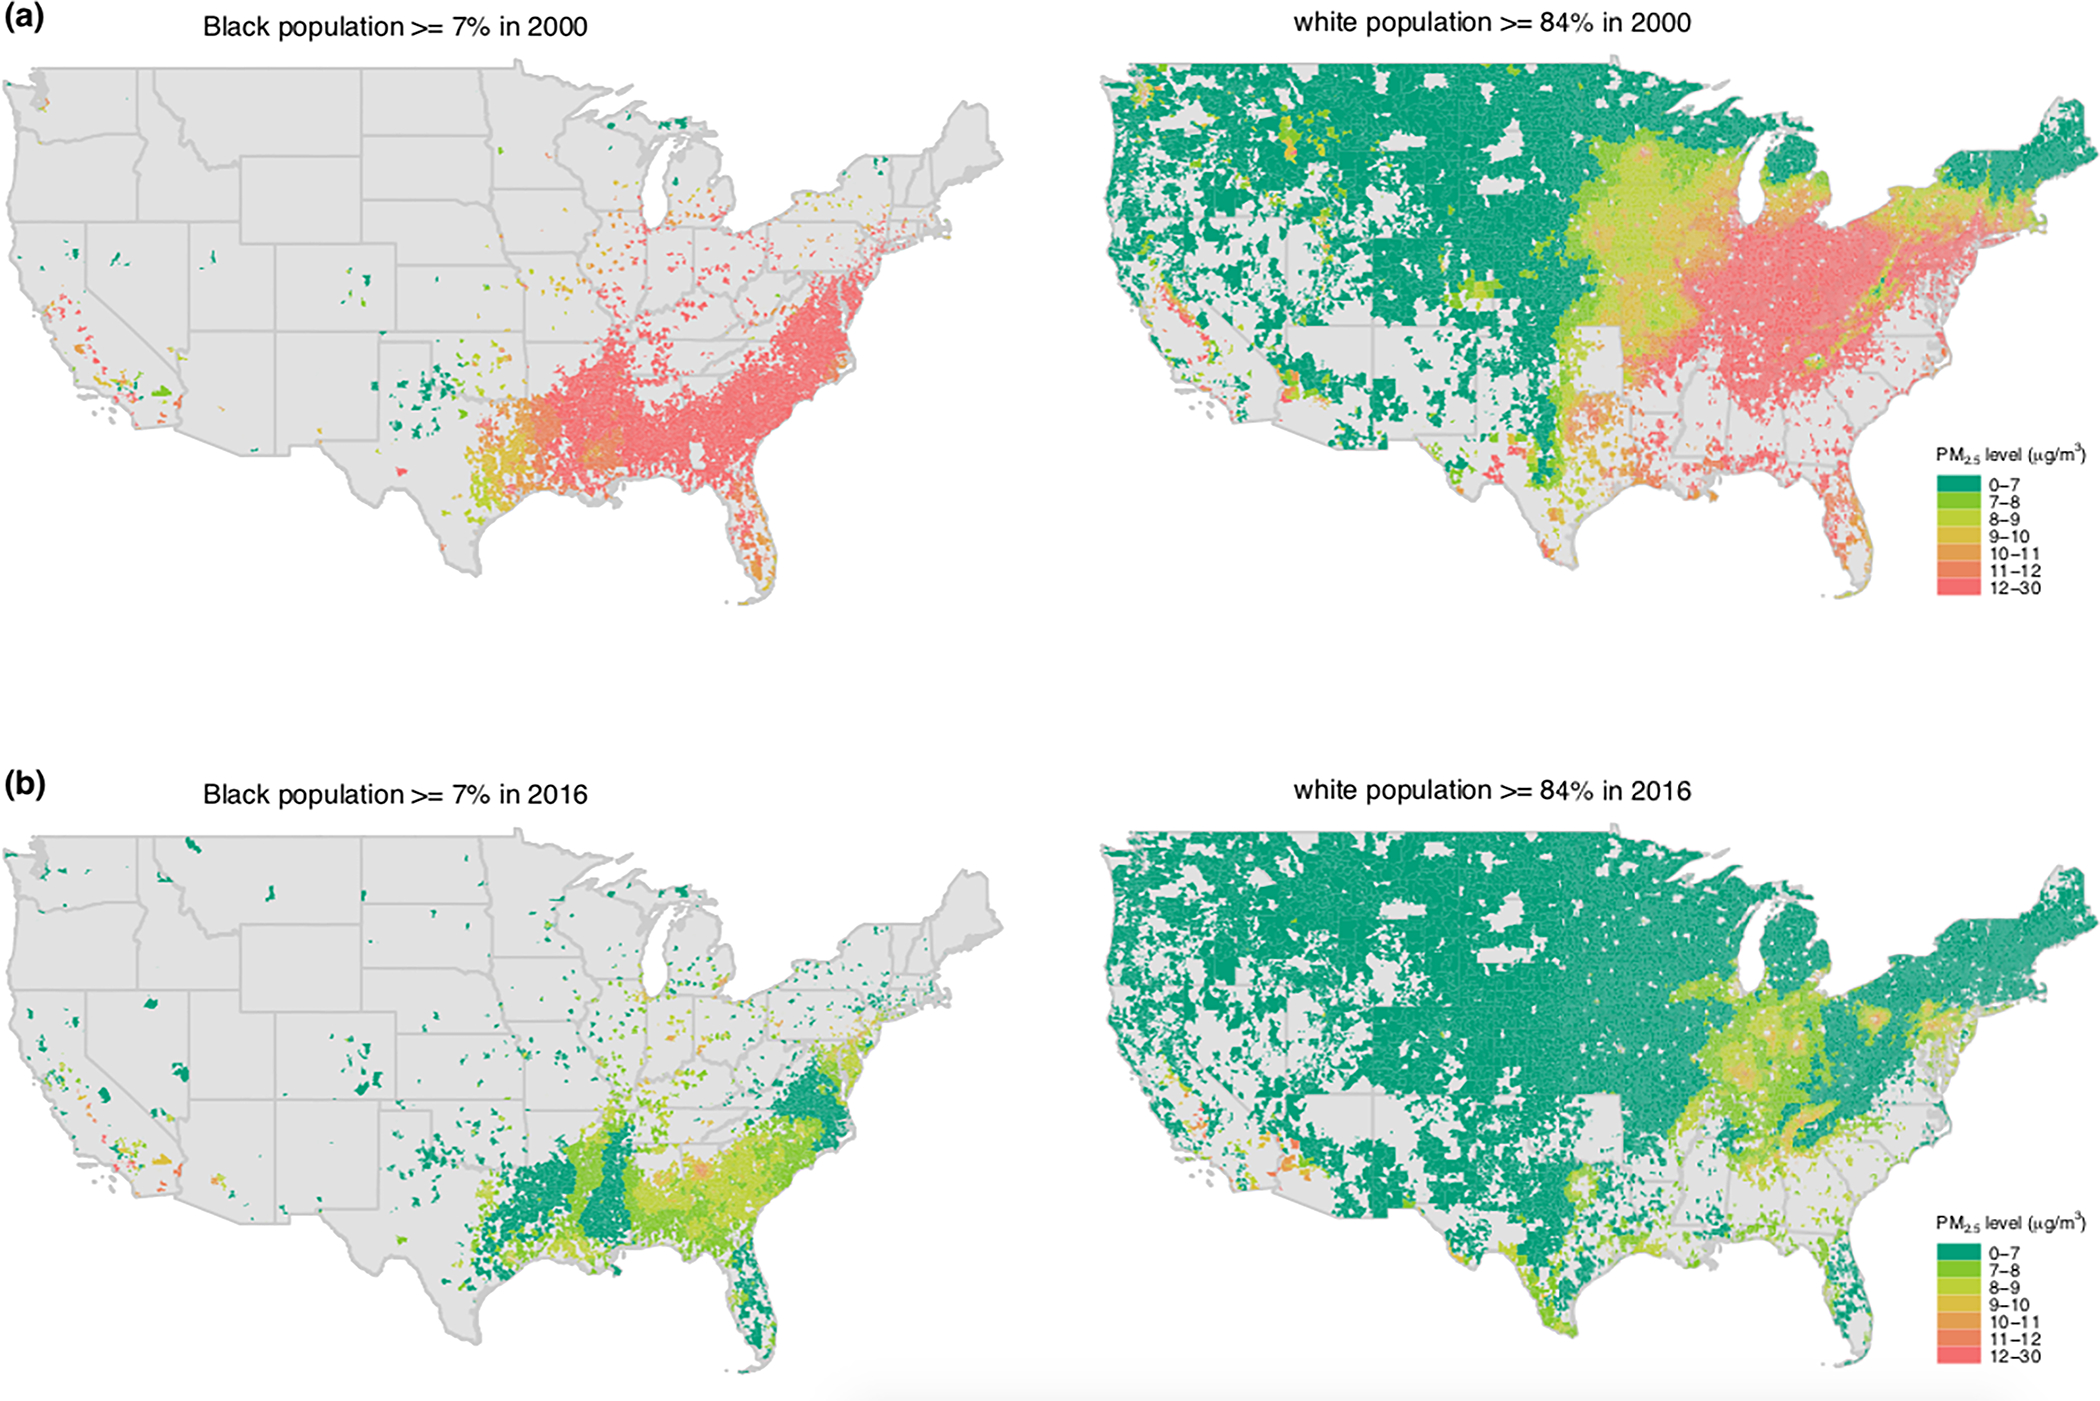
Figure 1. Average concentration in 2000 and 2016 across ZCTAs where Black and white populations are overrepresented:

We use the white population fraction of the ZCTA population to compute the average white population fraction (aWpf) across all ZCTAs (≈ 84%). Similarly, we compute the average Black population fraction (aBpf) (≈ 7%). The maps in panel (a) show levels for the year 2000 in ZCTAs with a Black population fraction above aBpf (left) and in ZCTAs with a white population fraction above aWpf (right). High concentrations exist in almost all ZCTAs with a Black population above aBpf, while a wide range of low and high concentrations exist in ZCTAs with a white population above aWpf in 2000. Panel (b) shows the same information for the year 2016. Similar maps for the other racial/ethnic groups for 2000 and 2016 are shown in Extended Data figures 1.a and 1.b and videos 2 and 3 in supplementary material.
