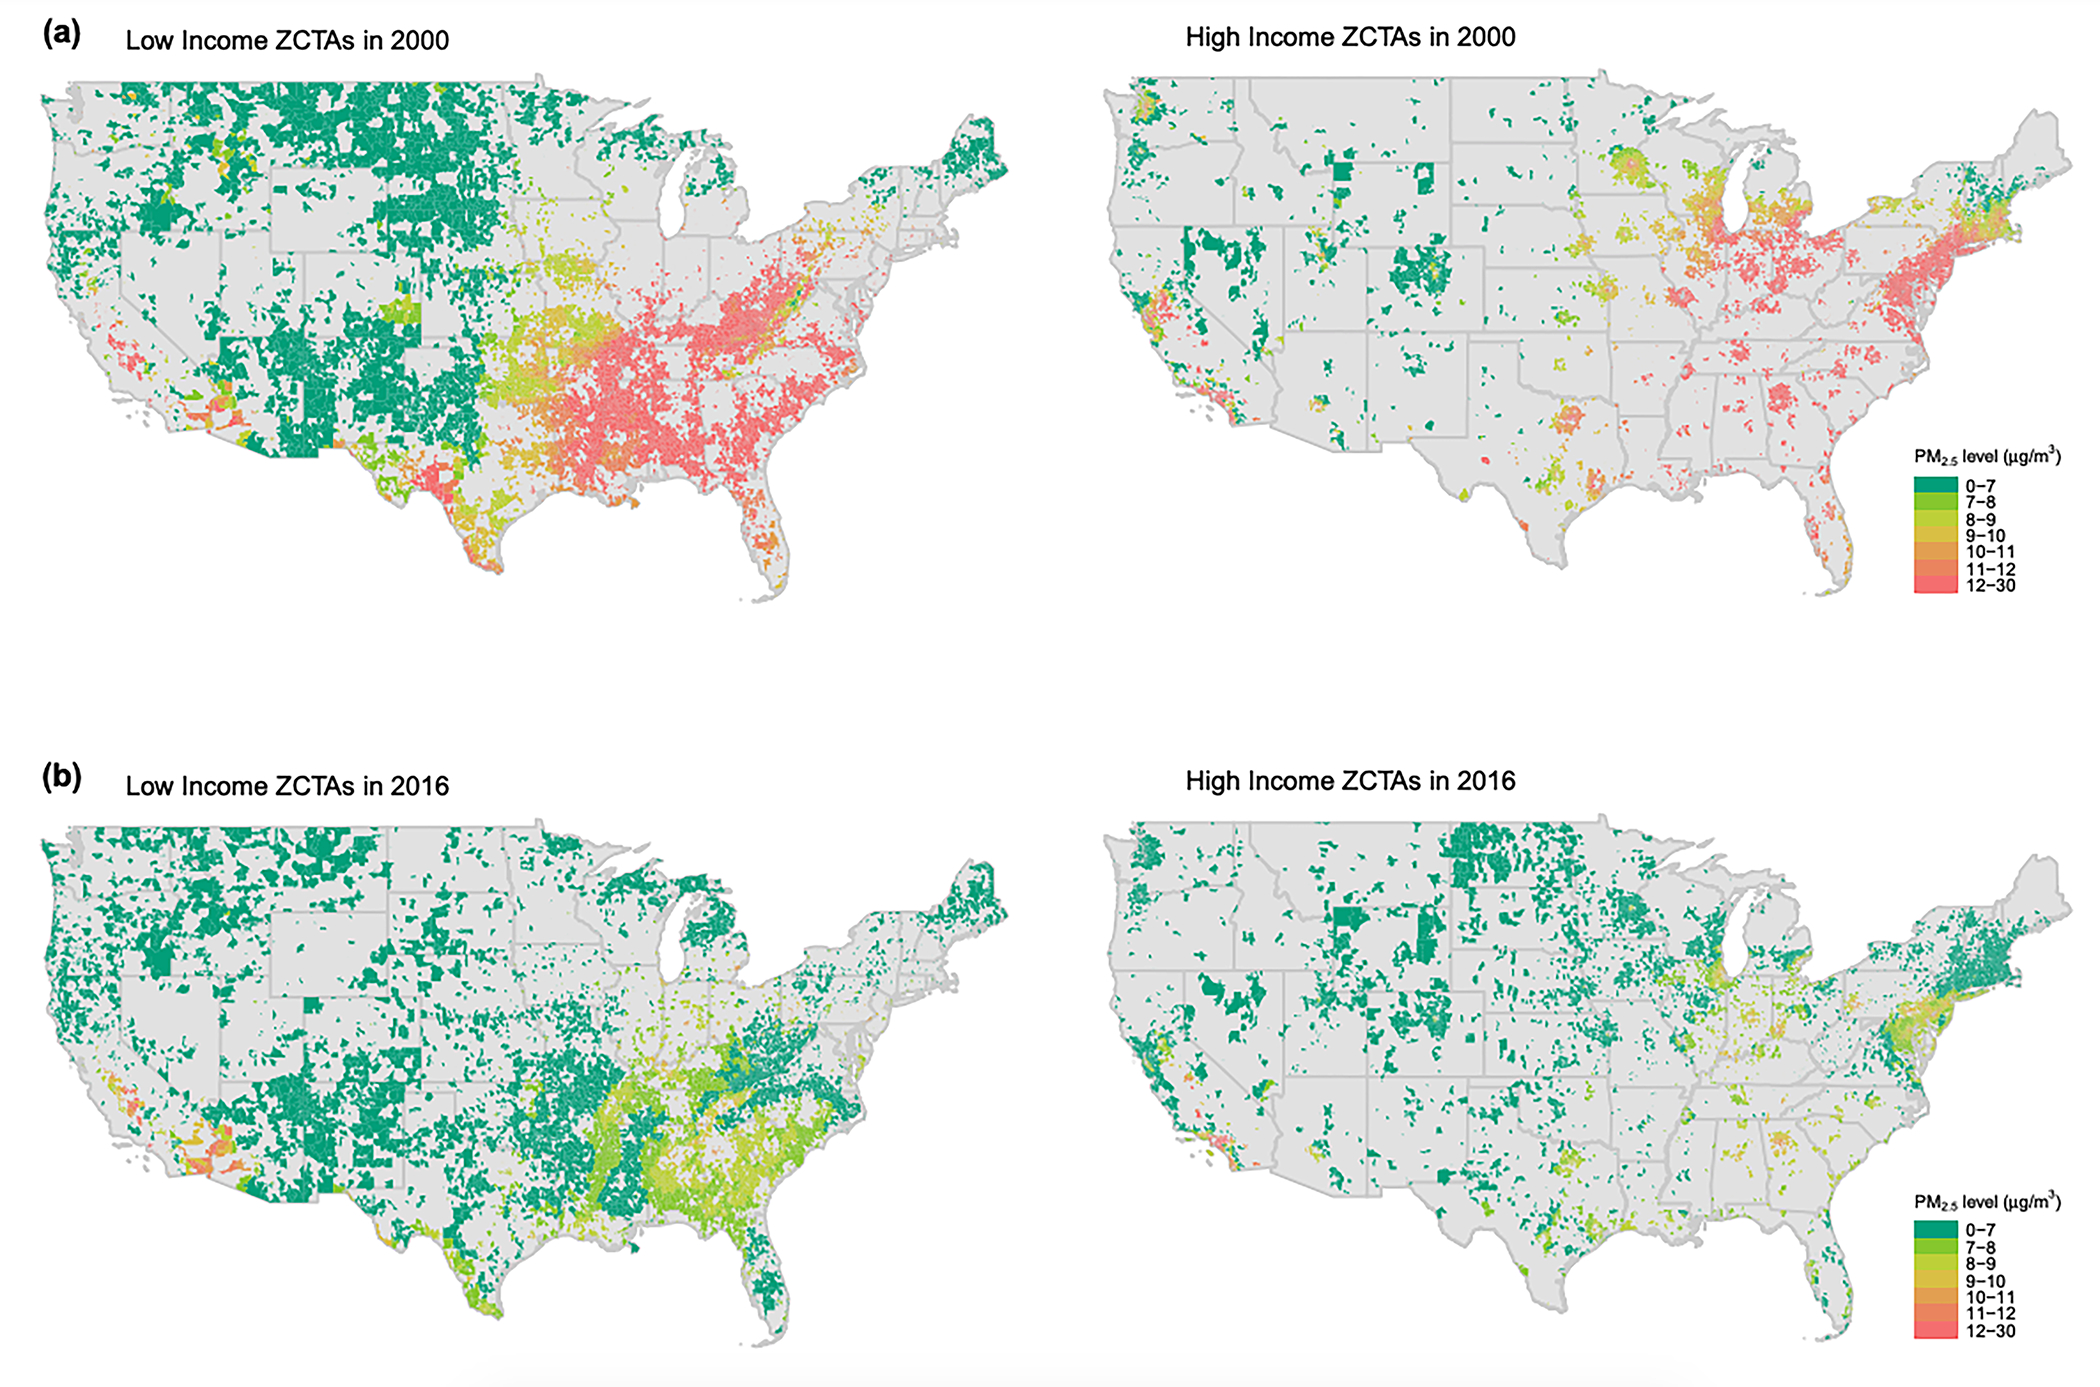
Figure 2. Average concentration in 2000 and 2016 across low- and high-income ZCTAs:

We assign all ZCTAs percentile ranks from 1 to 100 based on median household income and categorize them into ten income groups. We designate the lowest and highest three income groups as low-income and high-income respectively. The maps in panel (a) show levels for the year 2000 in low-income (left) and high-income (right) ZCTAs. Panel (b) shows the same information for the year 2016. Disparities in exposure to among the two groups are apparent and it can be visually seen that in both 2000 and 2016, low-income ZCTAs are exposed to higher concentrations as compared to high-income ZCTAs (video 4 in supplementary material).
