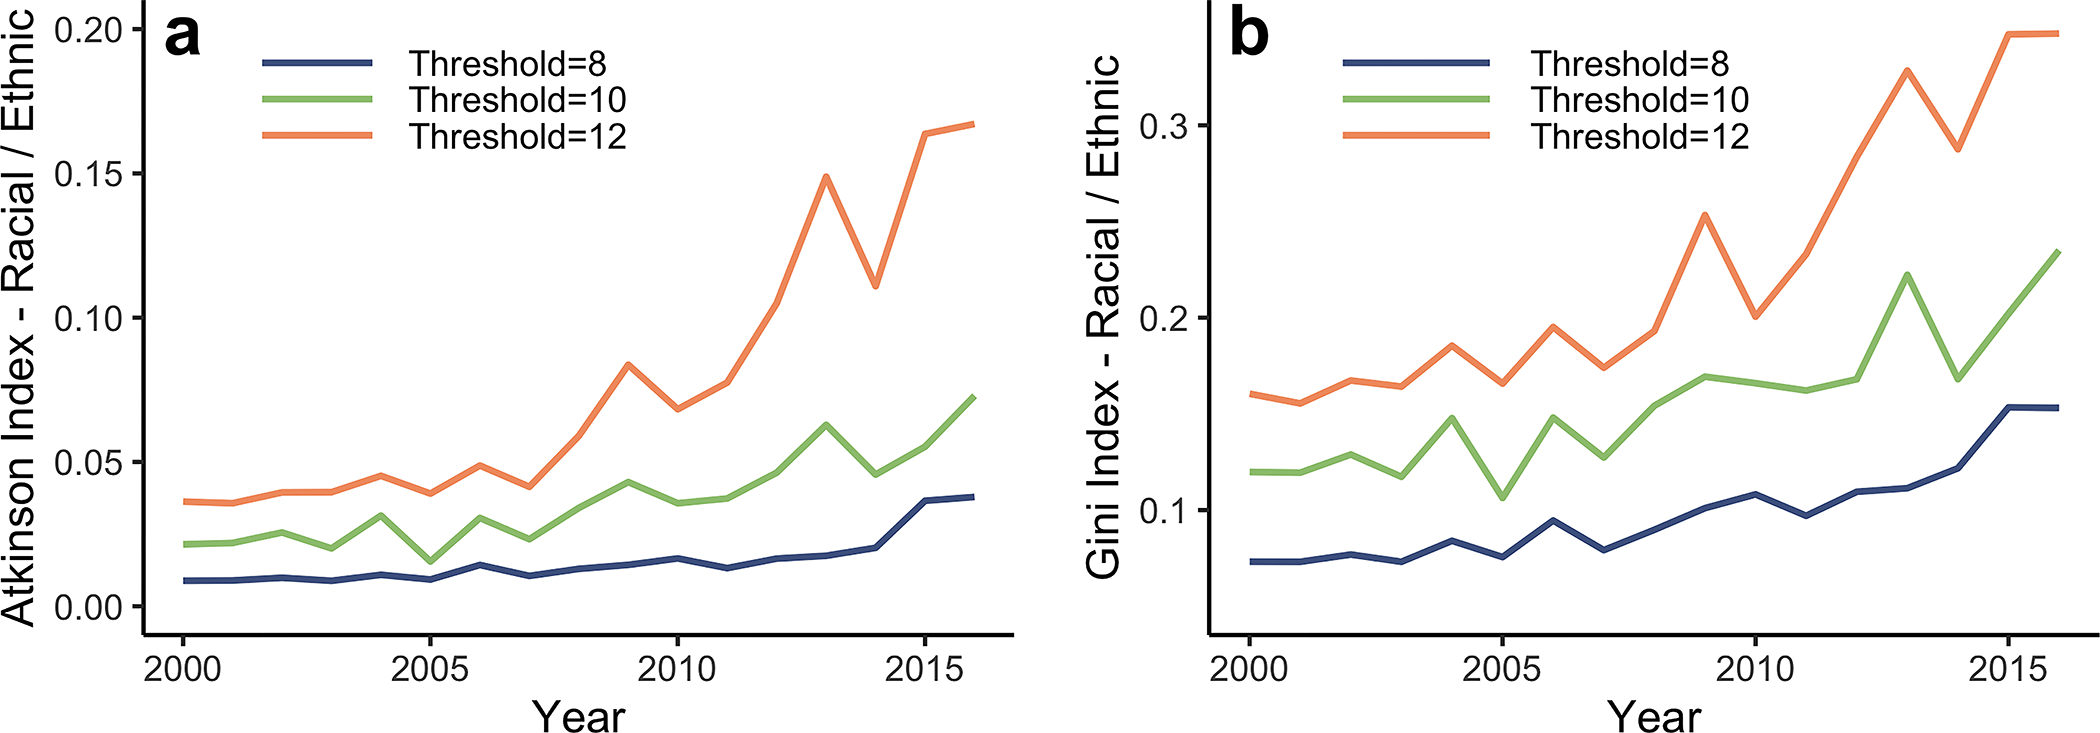
Extended Data Figure A.5. Supplementary measures of relative disparities in exposure to concentrations from 2000 to 2016 among racial/ethnic groups:

a, The Atkinson index is computed to measure relative disparities among the racial/ethnic groups (Black, white, Asian, Native American and Hispanic or Latino). b, The Gini index is computed to measure relative disparities among the racial/ethnic groups (Black, white, Asian, Native American and Hispanic or Latino). The trends in both the Atkinson and Gini indices are similar to the one measured by CoV in figure 4: disparities in air pollution exposure among racial/ethnic groups relative to pollution levels at or below the EPA standard are increasing. The Atkinson and Gini indices were computed using the inequality package “ineq” in the R software. The input is the proportion of the racial/ethnic (or income) groups living above the set threshold. We set the Atkinson aversion parameter = 0.75 [7], and the sensitivity of the index to different values of is shown in Extended Data Figure A.6.
