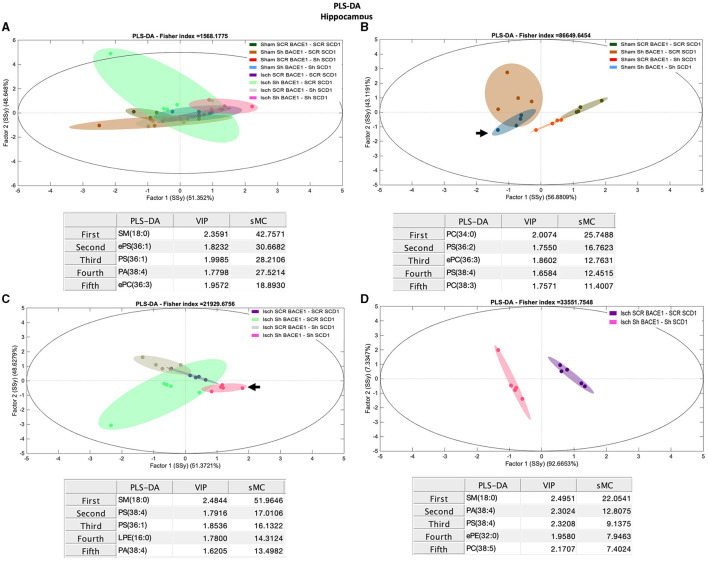
Figure 3.
Discrimination of the lipid profile of the hippocampus from cognitive improvement in an animal model silenced for BACE1 and SCD1 genes. Multivariate analyses of the lipid profiles from the A–D hippocampus. Score plots of PLS-DA and partial least squares analysis to discriminate between the lipid classes also show the projections of the data with the sMC and VIP metrics and values from sMC and VIP in a table per item. The variables in the analyses are as follows: Sham ScrBACE1-scrSCD1, Sham shBACE1-scrSCD1, Sham scrBACE1-shSCD1, Sham shBACE1-shSCD1; Isch ScrBACE1-scrSCD1, Isch shBACE1-scrSCD1, Isch scrBACE1-shSCD1, Isch shBACE1-shSCD1. PA, phosphatidic acid; PC, phosphatidylcholine; LPC, lysophosphatidylcholine; ePC, ether phosphatidylcholine; PS, phosphatidylserine; ePS, ether phosphatidylserine; PE, phosphatidylethanolamine; LPE, lysophosphatidylethanolamine; ePE, ether phosphatidylethanolamine; PI, phosphatidylinositol; PG, phosphatidylglycerol; SM, sphingomyelin, n = 5 per group.

