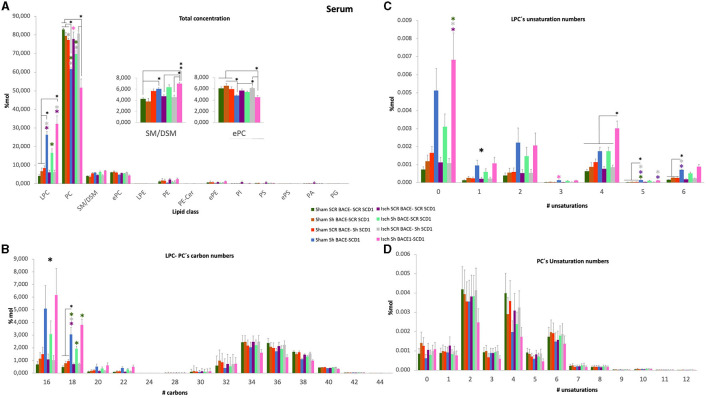
Figure 6.
General changes of total concentration, carbon length, and unsaturations of PLs from the serum of cognitively recovered animal models silenced for BACE1 and SCD1 genes. (A) The lipid class profiles are expressed as % Mol composition observed in the serum. (B) LPC-PC chain lengths equal to the total number of carbon atoms in the fatty acid moieties; (C) LPC and (D) PC unsaturations equal to the total number of double bonds in the fatty acid moieties for the analyzed lipid extract from serum. All lipid species were measured (means), and the error bars represent the SEM. ANOVA or Kruskall-Wallis test followed by Tukey's or Dunnett's T3 post-hoc test according to the normality test. *p < 0.05, **p < 0.01, ***p < 0.001; a single large black asterisk means that there are differences between groups, but not by post-hoc test. Color asterisks indicate differences between compared groups, according to the color bar. The data are expressed as % Mol. n = 5 per group. The variables in the analyses are as follows: sham ScrBACE1-scrSCD1, sham shBACE1-scrSCD1, sham scrBACE1-shSCD1, sham shBACE1-shSCD1; Isch ScrBACE1-scrSCD1, Isch shBACE1-scrSCD1, Isch scrBACE1-shSCD1, Isch shBACE1-shSCD1.

