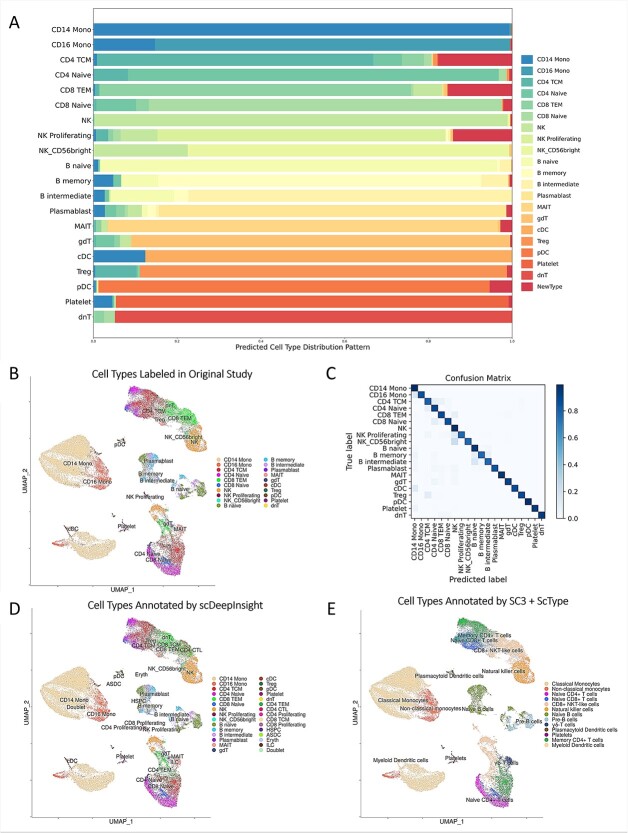
Figure 4.
Cell-type labels of the reference dataset and prediction results on dataset Schulte–Schrepping. (A) The stacked percentage column chart of the prediction results on the Schulte–Schrepping dataset. (B) UMAP representation colored by cell-types in the original study. (C) Heatmap of the confusion matrix. (D) UMAP representation colored by cell-types predicted by scDeepInsight. (E) UMAP representation colored by annotation results using SC3 clustering with ScType.

