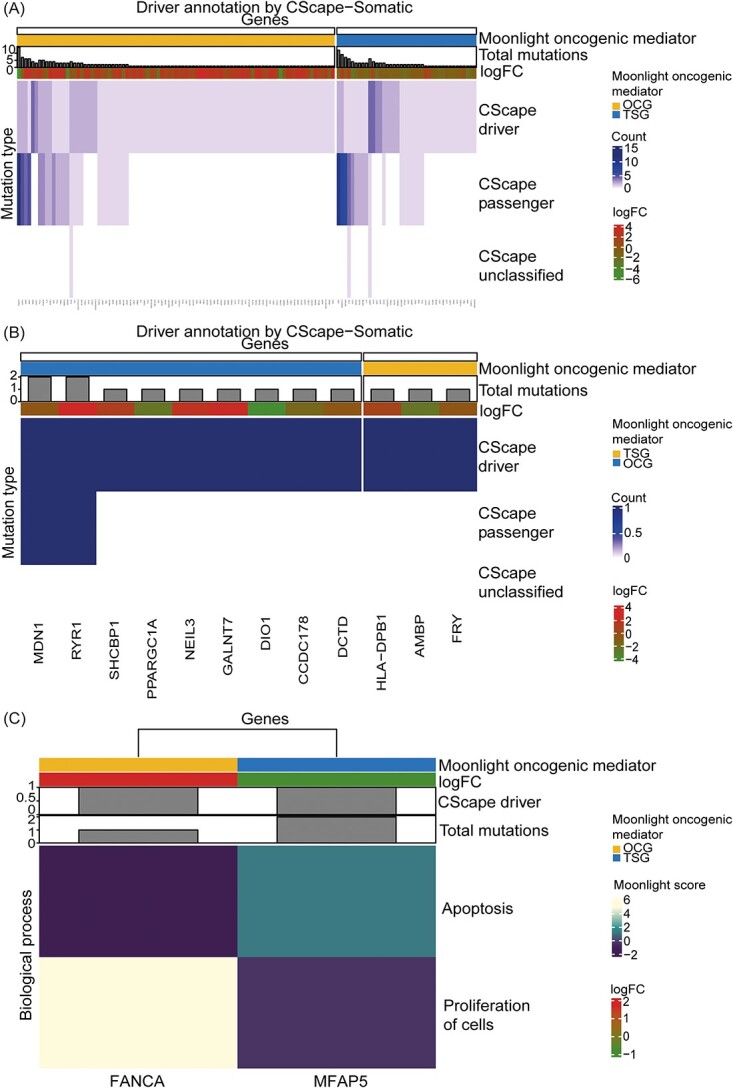
Figure 7.

Classification of mutations in predicted driver genes in lung adenocarcinoma and thyroid carcinoma by Moonlight. (A) Classification of mutations in the 131 driver genes predicted in lung adenocarcinoma. (B) Classification of mutations in the 12 driver genes predicted in thyroid carcinoma. In (A) and (B), genes are in the columns while the mutation type classified by CScape-somatic is in the rows. The values in the heatmap indicate the number of driver, passenger, and unclassified mutations. The total number of mutations and log2FC values of the driver genes are shown in the heatmap. (C) Driver genes (one oncogene and one tumor suppressor) in lung adenocarcinoma with a driver mutation in an experimentally validated promoter region from ENCODE. The columns are genes and the rows are the Moonlight Gene Z-scores for the two biological processes selected in the expert-based approach: apoptosis and proliferation of cells. The number of driver mutations, the number of total mutations and the log2FC values of the driver genes are included.
