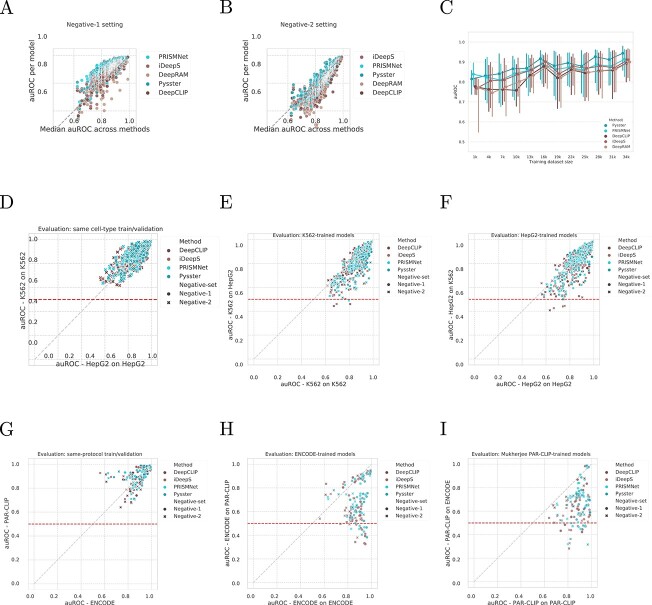
Figure 4.
Influence of input modalities. (A and B) Stability of models’ performance per RBP across single-label architectures. Each point is a model for an RBP and a method, plotted against the RBP’s median AUROC across methods, in the negative-1 (A) and negative-2 (B) settings. (C) Correlation between model performance and dataset size, over the range of dataset sizes from ENCODE. Models are grouped per training dataset bin size (bin size = 2000). Dots represent the median AUROC of models per bin, for each method. Error bar: 25–75% interquartile. (D) Comparison of AUROCs for 73 RBPs evaluated in two different cell-types from the ENCODE dataset. Models are paired on the RBP names, while the AUROCs are computed on sequences derived from the same-cell type used for training. (E and F) Comparison of auROCs for 73 RBPs evaluated in two different cell-types from the ENCODE dataset, comparing the performance on same-cell-type evaluation (x-axis) against the performance from cross-cell-type evaluation (y-axis) for K562-trained models (E) and HepG2-trained models (F). Red line: random performance. (G) Comparison of auROCs for 17 RBPs matched between Mukherjee’s PAR-CLIP and ENCODE eCLIP experiments. Models are paired on the RBP names, while the auROCs are computed on sequences derived from the same experimental-protocol used for training. (H and I) Comparison of AUROCs for 17 RBPs matched between Mukherjee’s PAR-CLIP and ENCODE eCLIP experiments, comparing the performance on same-protocol evaluation (x-axis) against the performance from cross-protocol evaluation (y-axis) for ENCODE trained models (H) and PAR-CLIP trained models (I). Red line: random performance.

