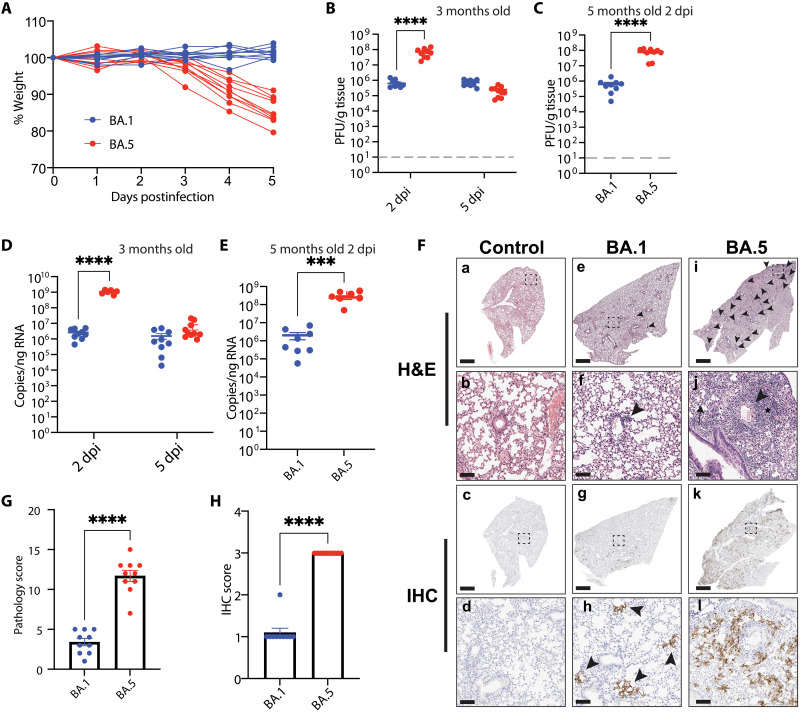
Fig. 2. SARS-CoV-2 Omicron BA.5 induces increased pathology at 5 dpi.
(A) Three-month-old K18-hACE2 mice (n = 10 per Omicron variant) were infected with 3.25 × 10⁴ PFU of SARS-CoV-2 Omicron BA.1 or BA.5. Weights were monitored daily, and mice were euthanized 5 dpi. Two-way ANOVA with Sidak’s multiple comparisons test. (B) Lung viral titers. Tissues were collected from 3-month-old infected mice 2 and 5 dpi and homogenized, and virus was collected for plaque assay. Two-way ANOVA with Tukey’s multiple comparisons test. Data are means ± SEM. (C) Lung viral titers in the lung of 5-month-old mice 2 dpi. Two-tailed Mann-Whitney test. Data are means ± SEM. (D) Viral RNA in the lungs of 3-month-old mice at 2 and 5 dpi by qRT-PCR. Two-way ANOVA with Tukey’s multiple comparisons test. Data are means ± SEM. (E) Viral RNA in the lungs of 5-month-old mice 2 dpi. Two-tailed Mann-Whitney test. Data are means ± SEM. (F) Representative H&E staining (a, b, e, f, i, and j) of lung histopathology or IHC staining with an anti–SARS-CoV-2 N protein antibody (c, d, g, h, k, and l) (one section analyzed per mouse) at death or study endpoint in control (a to d) or mice infected with Omicron BA.1 (e to h) or Omicron BA.5 (i to l). Perivascular infiltrates (arrowheads) were more numerous in mice infected with Omicron BA.5 compared to Omicron BA.1. Mice infected with Omicron BA.5 developed interstitial infiltrates (asterisk) and inflammatory cells in alveoli (arrow). Scale bars, 1 mm (a, c, e, g, i, and k) and 100 μm (b, d, f, h, j, and l). For histopathology and IHC analyses, representative images were selected on the basis of mean pathology score. (G) Quantification of the histopathology in the lung. Two-tailed Mann-Whitney test. Data are means ± SEM. (H) Quantification of virus nucleoprotein positive lung sections. Two-tailed Mann-Whitney test. Data are means ± SEM. ***P < 0.001, ****P < 0.0001.

