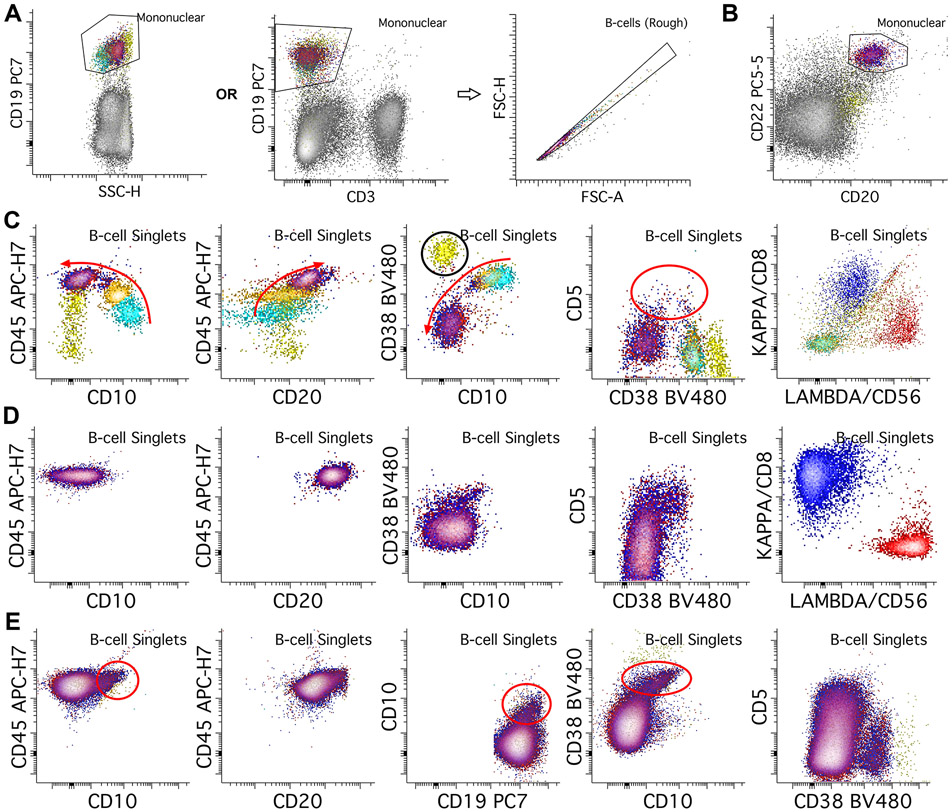
Figure 2.
B-cell gating and normal patterns. A. B-cells are initially gated using CD19 versus SSC (log scale) plot, or alternatively with CD19 versus a T-cell marker such as CD3 to include B-cells and exclude T-cells from further B-cell assessment. We then place a second, B-cell singlet gate to further reduce B-cell aggregates. B. In some situations B-cells may lose CD19 expression or the antibody may not bind to B-cells due to interference from therapeutic agents; in these cases, if only mature B-cells assessment is being performed, alternative markers such as CD20 and/or CD22 can be used to gate for B-cells. C. In the bone marrow, the most immature B-cells (hematogones, light blue population) express bright CD10 and CD38, without CD20 or light chains, and with dim CD45. As the B-cells mature through intermediate (orange population) and mature stages (red/blue overlayed), they lose CD10 and CD38, while gaining CD20, CD45, and either kappa or lambda surface light chains (red arrows show changes with maturity). A transitional B-cell component can also express CD5 (red circle). Note also the plasma cells with brightest CD38 (yellow population, black circle). D. In normal peripheral blood, only mature B-cell populations (red and blue populations) should be present, with small amounts of transitional cells which can express CD5 and CD10. E. In benign lymph node specimens, normal B-cells typically show a germinal center component that expresses dim CD10 and bright CD38. Transitional B-cell populations can also be seen like those in peripheral blood.

