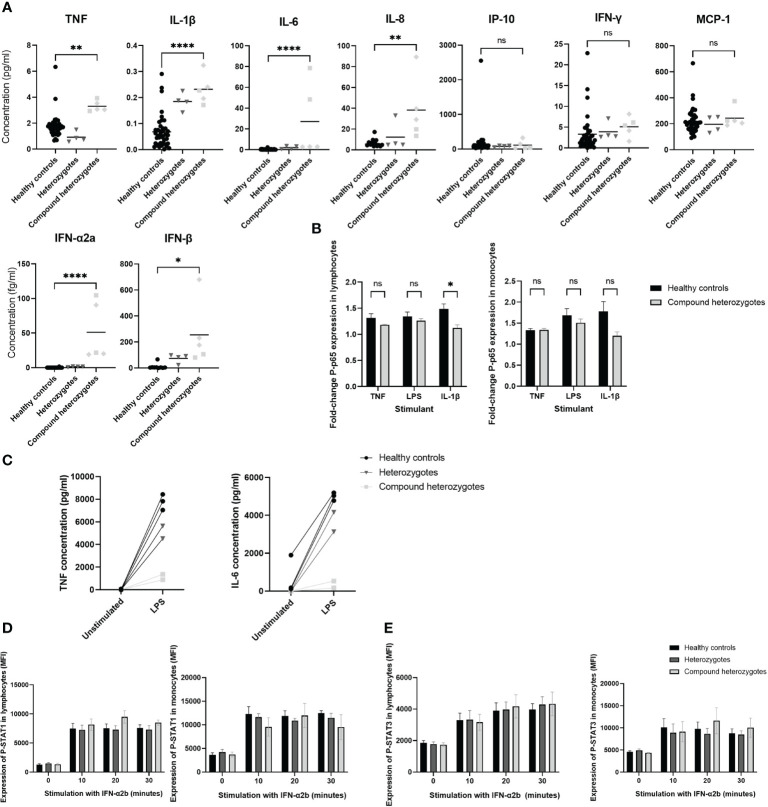
Figure 4.
Functional evaluation of IRAK-4 signaling. (A) Pro-inflammatory cytokine quantification in sera using Meso Scale Discovery. Healthy controls (black circles), heterozygote parents (dark grey inverted triangles) and compound heterozygotes from Family A (light grey squares) and Family B (light grey diamonds), are shown. (B) NF-κB signaling assessed via flow cytometry analysis of phosphorylated-p65 (P-p65) stimulated with ligands as indicated on x-axis, fold-change median fluorescence (MFI) from baseline at 20 minutes shown. (C) Analysis of interleukin-6 (IL-6) and tumor necrosis factor (TNF) production by peripheral blood mononuclear cells (PBMC) from Family A in response to lipopolysaccharide (LPS) stimulation. (D) STAT1 and (E) STAT3 signaling assessed via flow cytometry analysis of phosphorylated-STAT1 (p-STAT1) and STAT3 (p-STAT3) expression following stimulation with interferon α2b (IFN-α2b) at time points indicated on x axis. Horizontal lines at mean and standard error (SE) of the mean shown. Significance indicated by: *p < 0.05; ** p < 0.01; and ****p < 0.0001 and ns, not significant. TNF, tumor necrosis factor; IL, interleukin; IP-10, interferon-γ induced protein-10; MCP-1, monocyte chemoattractant protein-1; IFN, interferon; LPS, lipopolysaccharide; p-STAT1/3, phosphorylated signal transducer and activator of transcription 1/3; MFI, median fluorescence intensity.

