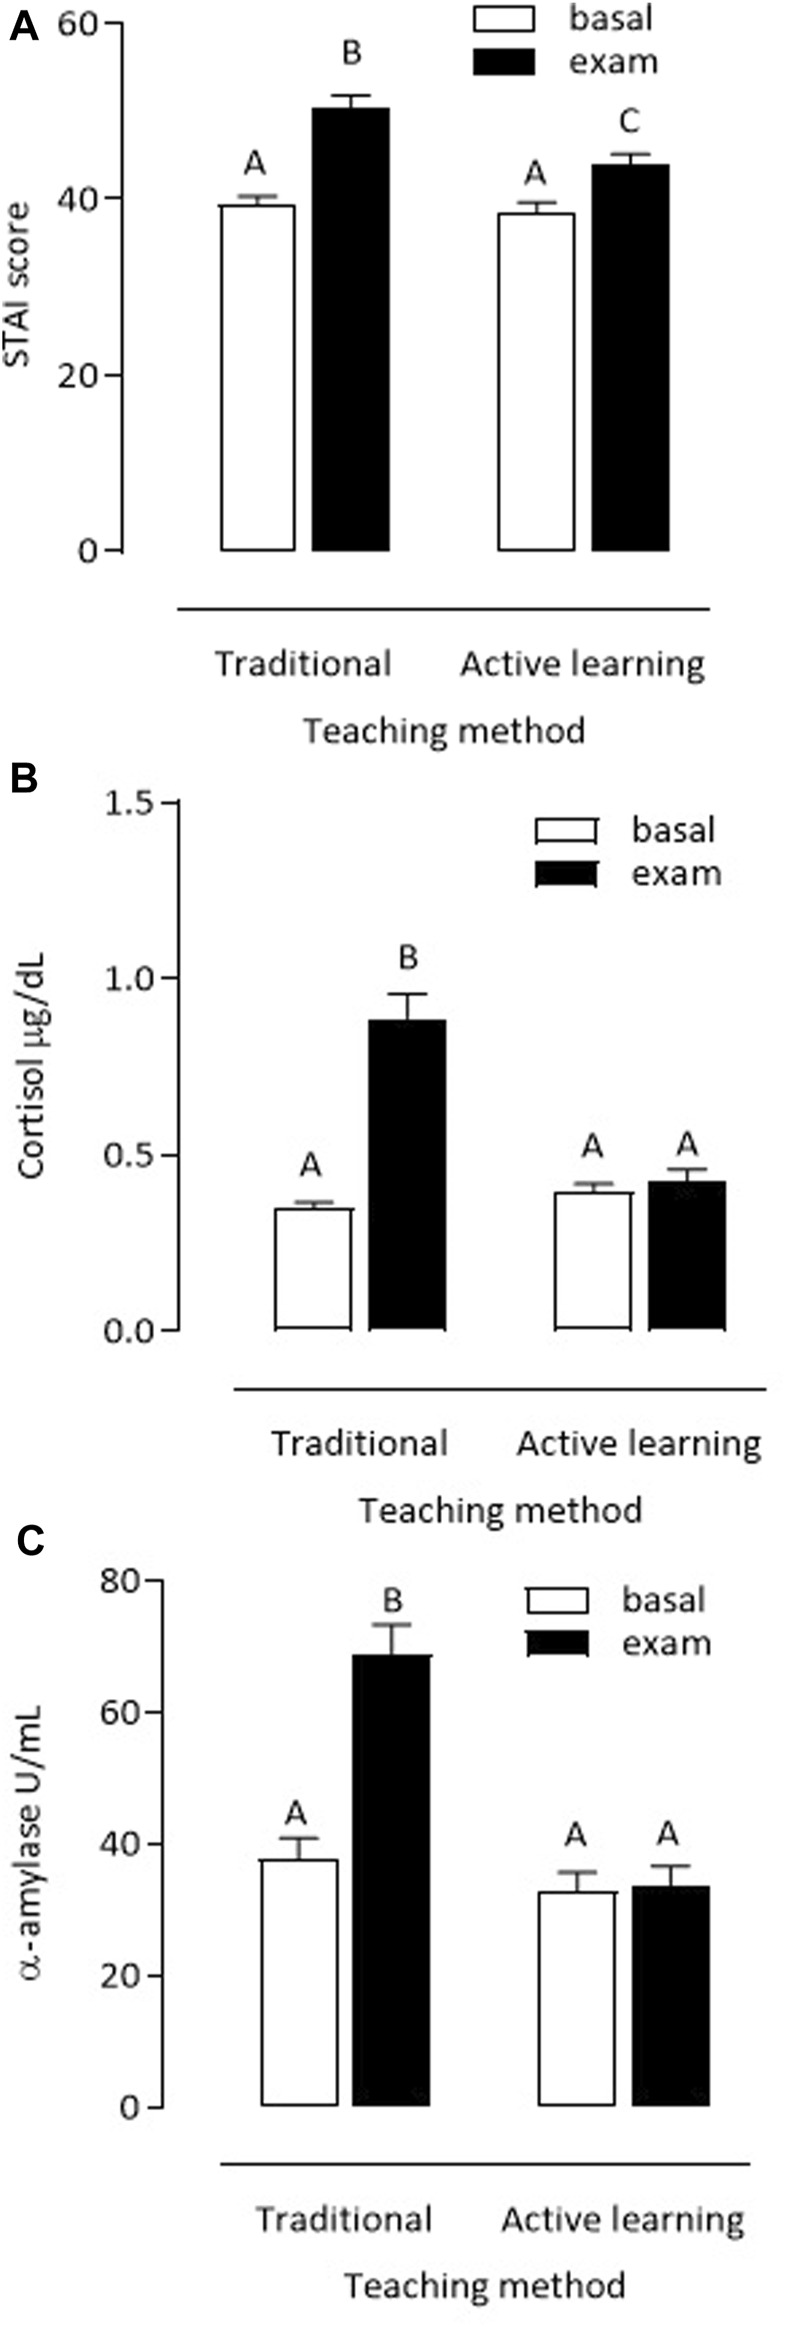
FIGURE 2.

Student anxiety levels assessed using the STAI questionnaire (A) and saliva concentrations of the stress markers cortisol (B) and α-amylase (C), before the tests applied after the cardiac physiology classes taught using the traditional (n = 51) or active (n = 52) methodologies. Different letters indicate significantly different values (two-factor analysis of variance + Tukey’s test, p < 0.05).
