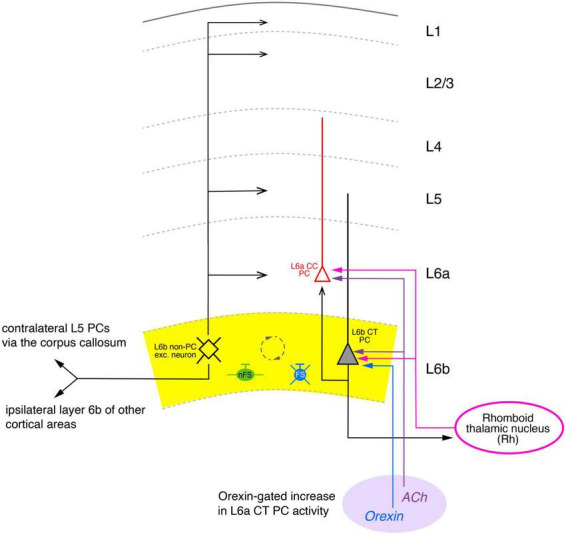
FIGURE 5.

Simplified diagram of the synaptic connectivity in the parietal association cortex (PtA). The PtA L6b connectivity diagram was derived from stimulations of L6b excitatory neurons with co-applications of orexin-B and nicotine that resulted in AP firing of these neurons. In the Pta, synaptic input from multipolar PtA L6b neurons (color-coded in black) to all cortical layers was identified. Furthermore, ipsilateral long-range synaptic connections predominantly to layer 6a CC PCs (red) and 5 of adjacent cortical areas were also found. In addition, orexin/nicotine-activated synaptic input to contralateral L5 PCs was also recorded. Furthermore, L6b and L6a excitatory neurons received thalamocortical input from the Rhomboid thalamic nucleus (magenta). Furthermore, a dense network between L6b excitatory neurons, nFS (green), and L6 FS (PV+) interneurons (blue) was identified (indicated by the dashed circle). Simplified diagram of the synaptic connectivity in the parietal association (PtA) cortex. Different arrow heads signify: ▶ synaptic input to S1 layer 6b; >synaptic output from S1 layer 6b; inhibitory input is marked by bars. See main text for details).
