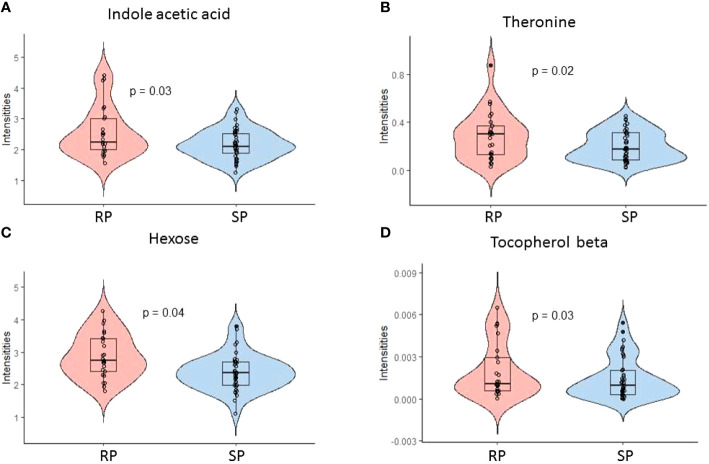
Figure 3.
Polar metabolite profiles in serum before and after the first appearance of islet autoantibodies comparing rapid (RP) and slow progressors (SP) to type 1 diabetes. (A-D) Violin plot showing the selected discriminating metabolites between the SP and RP. Here, RP and SP is analyzed after the appearance of the first islet autoantibody.

