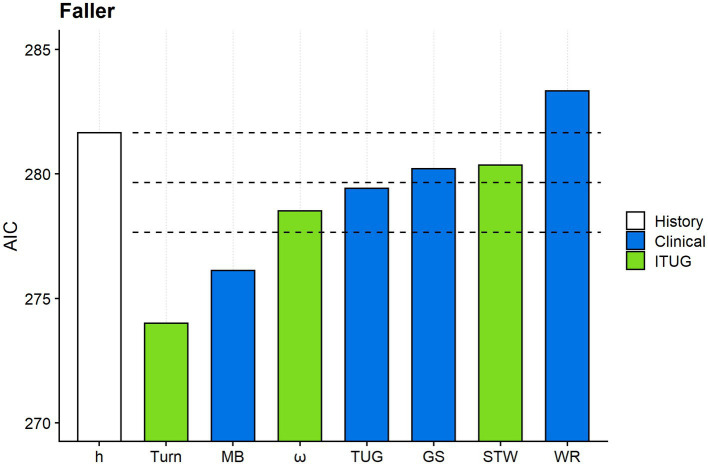
Figure 2.
Comparing the criterion validity of the gait and mobility measures. The figure shows the Akaike information criterion (AIC) of model h and the seven h + models. Model h (white column) includes only fall risk factors from the medical history. For graphical reasons, Turn abbreviates model “h + Turn,” MB model “h + MB” and so on. Turn: duration of the TUG turning phase; MB: Mini-BESTest; ω: peak angular velocity along the vertical axis during the TUG turning phase; TUG: total TUG duration; GS: gait speed; STW: sit-to-walk duration; WR: walk ratio. Mobility measures from clinical tests and ITUG are given in blue and green, respectively. The uppermost horizontal dashed line marks the AIC of model h. The second and the third horizontal dashed lines mark −2 and −4 from the model h’s AIC. The response variable was the faller status (faller vs. non-faller) in all models.

