Figure 2.
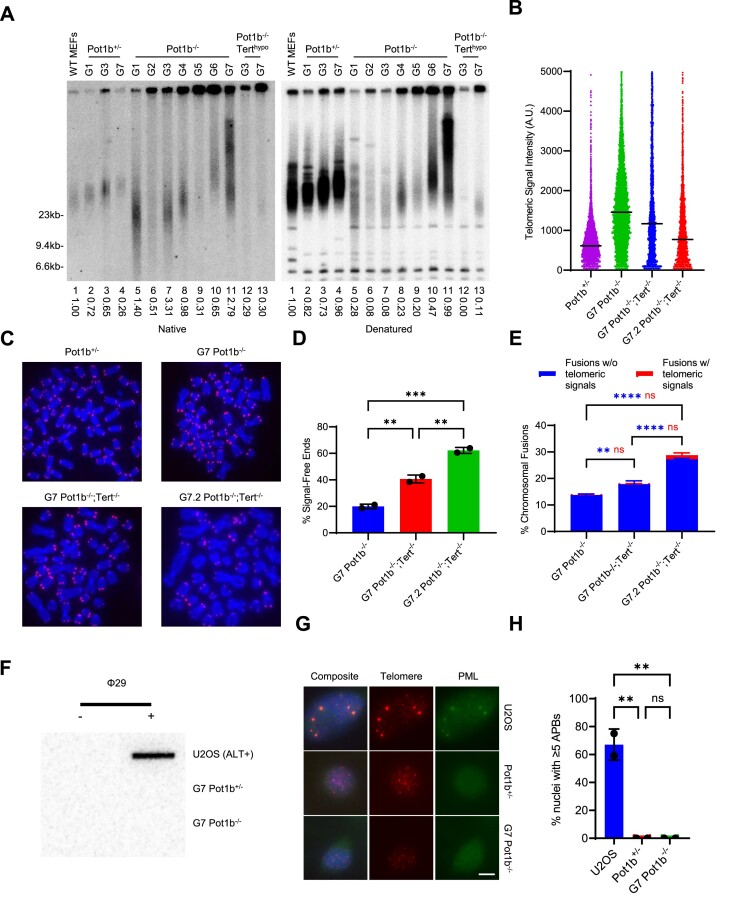
Telomere hyper-elongation is mediated by telomerase. (A) TRF Southern blot detection of G-overhang in native gel and total telomere length in denatured gel hybridized with γ-32P-(CCCTAA)4 telomere probe. Numbers indicate relative G-overhang and total telomere signals, with telomere signals set to 1.0 for WT MEFs. Molecular weight markers as indicated. (B) Q-FISH analysis showing the median telomeric signal intensity from metaphases in (C). 30 metaphases were scored per cell line. (C) Representative images of metaphase spreads of the indicated cell lines visualized with PNA-FISH probe Cy3-OO-(CCCTAA)3 and DAPI. Scale bar: 5 μm. (D) Quantification of signal-free ends in metaphases in (C). Data show the mean ± standard deviation from two independent experiments with 30 metaphases analyzed for each cell line per experiment. P-values are shown and generated from one-way ANOVA analysis followed by Tukey's multiple comparison. (E) Quantification of chromosomal fusions from metaphases in (C). Data show the mean ± standard deviation from two independent experiments with 30 metaphases analyzed for each cell line per experiment. P-values are shown and generated from two-way ANOVA analysis followed by Tukey's multiple comparison. Blue P-values are used for chromosomal fusions without telomeric signals. Red P-values are used for chromosomal fusions with telomeric signals. (F) C-circle detection in the indicated cell lines. Slot-blot of C-circle assay performed on genomic DNA with and without Phi29 DNA polymerase. U2OS was used as a positive control. (G) Representative images of APBs in the indicated cell lines. Cells were immunostained with α-PML antibody (green), telomere probe Cy3-(CCCTAA)3 (red) and DAPI to stain nuclei (blue). Scale bar: 5 μm. (H) Quantification of the indicated cell lines in (G) with α-PML foci colocalizing with telomeres. Data show the mean ± standard deviation from two independent experiments with 150 nuclei analyzed for each cell line per experiment. P-values are shown and generated from one-way ANOVA analysis followed by Tukey's multiple comparison. U2OS was used as a positive control.

