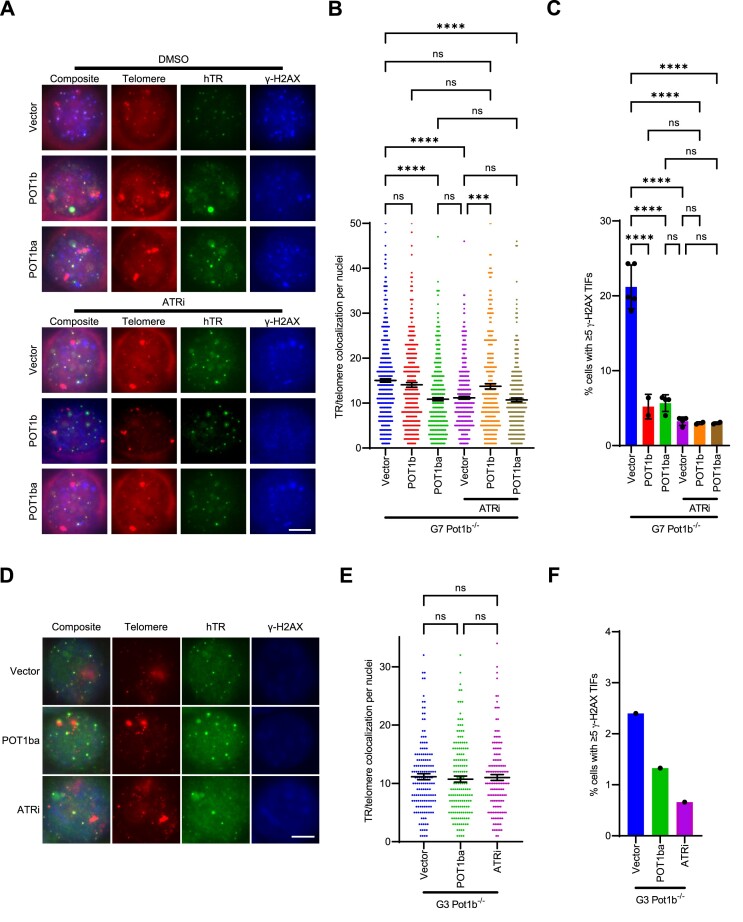
Figure 6.
Increased telomeric damage in G7 Pot1b−/− cells promotes telomerase recruitment to telomeres. (A) Representative images of telomerase recruitment assay in G7 Pot1b−/− cells treated with/without 150nM AZ20, and with/without expressing vector/POT1b/POT1ba. γ-H2AX (blue) were detected by immunostaining with anti-γH2AX antibodies. hTR RNA was detected by hybridization with Cy5-hTR cDNA probes (green) and telomeres visualized by hybridization with PNA probe Cy3-OO-(CCCTAA)3 (red). Scale bar: 5μm. (B) Quantification of telomerase and telomere colocalization in (A). Data show the mean ± 95% CI of the mean from at least two experiments with 150 nuclei analyzed per cell line. p-values are shown and generated from one-way ANOVA analysis followed by Tukey's multiple comparison. (C) Quantification of the indicated conditions with ≥ 5 γ-H2AX TIFs in (A). Data show the mean ± standard deviation from at least two independent experiments in which 150 nuclei were analyzed per cell line. P-values are shown and generated from one-way ANOVA analysis followed by Tukey's multiple comparison. (D) Representative images of telomerase recruitment assay in G3 Pot1b−/− cells treated with/without 150nM AZ20, with/without expressing POT1ba. γ-H2AX were detected by immunostaining with anti-γH2AX antibodies (blue). hTR RNA was detected by hybridization with Cy5-hTR cDNA probes (green) and telomeres visualized by hybridization with PNA probe Cy3-OO-(CCCTAA)3 (red). Scale bar: 5 μm. (E) Quantification of telomerase and telomere colocalization in (D). Data show the mean ± 95% CI of the mean with 150 nuclei analyzed per cell line. P-values are shown and generated from one-way ANOVA analysis followed by Tukey's multiple comparison. (F) Quantification of the indicated conditions with ≥5 γ-H2AX TIFs in (D). Data show the mean from 150 nuclei analyzed per cell line.

