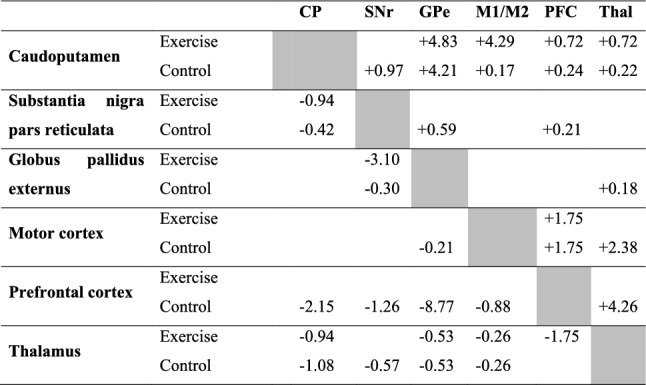
Table 2.
Between structure metabolic connectivity density. The top-right half of the table shows positive connectivity densities, which are marked with "+". The lower-left half of the table shows negative connectivity densities, marked with "-". Connectivity density is defined as the number of connections (statistically significant correlations after jackknife correction) expressed as a percentage of the total number of ROI pairs between two specified brain structures. n = 10/group

