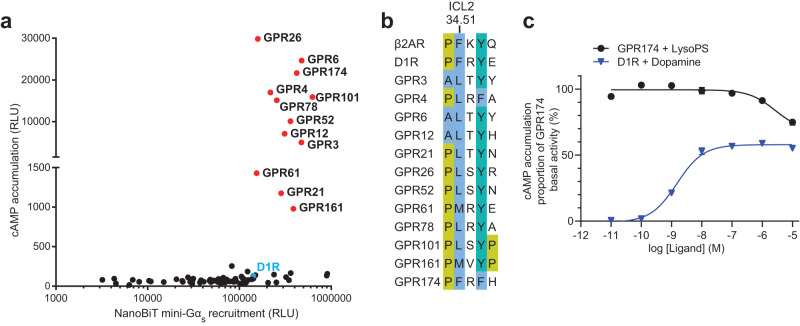
Fig. 1. A group of class A oGPCRs dramatically increase cAMP levels via the Gs pathway.
a GloSensor cAMP accumulation assay and NanoBiT mini-Gs recruitment assay performed in Expi293F cells transiently expressing any of 81 oGPCRs or D1R with relative luminescence unit (RLU) value shown. Receptors that show high cAMP levels compared with the other oGPCRs are colored in red. b Sequence alignment of ICL2 in caoGPCRs, D1R and β2AR. Residues are highlighted based on the Clustal color scheme. c Concentration–response curves in the cAMP accumulation assay at Expi293F cells transiently transfected with GPR174 or D1R treated with lysoPS or dopamine. Each data point represents mean ± SEM from three independent experiments. Source data are provided as a Source Data file.

