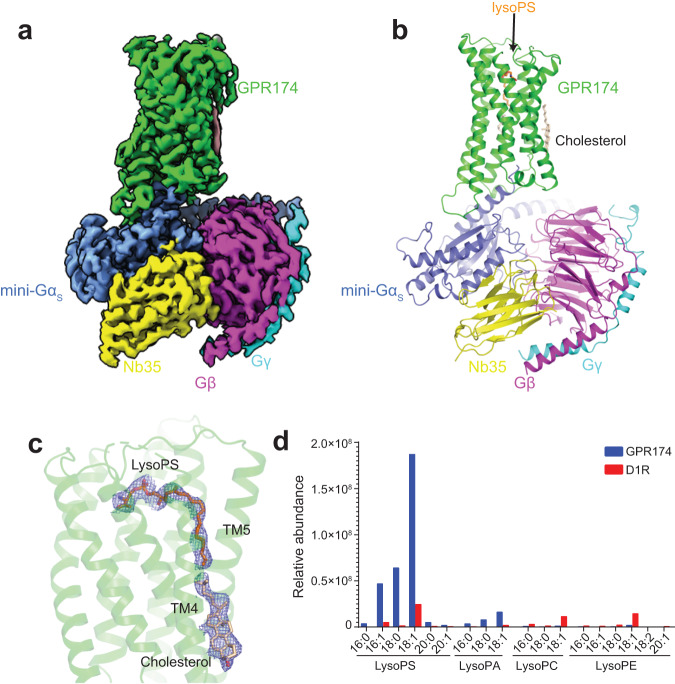
Fig. 2. The endogenous lysoPS is copurified with GPR174.
a Cryo-EM map of the GPR174 and mini-Gs complex. b Ribbon representation of the GPR174 and mini-Gs complex. LysoPS and cholesterol are shown as sticks. c Cryo-EM density map of lysoPS and cholesterol in the GPR174‒Gs complex at a contour level of 3.5σ. d Lipidomics analysis of the GPR174‒Gs and D1R‒Gs complexes by MS. The relative abundance of representative LPs with the acyl chain length from 16:0 to 20:1 determined by MS is shown. Source data are provided as a Source Data file.

