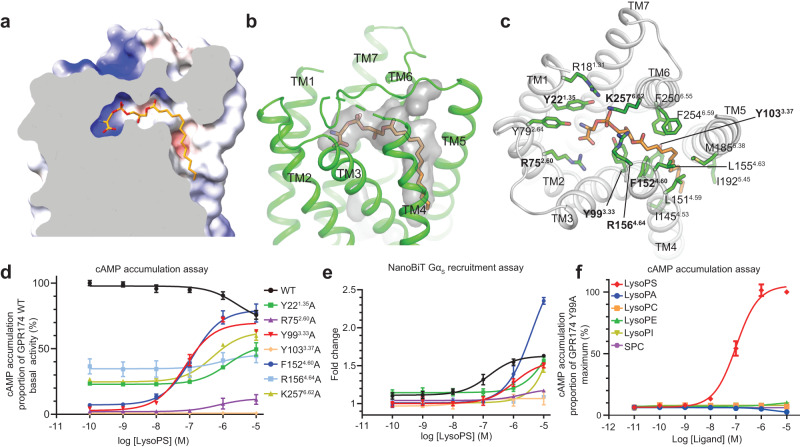
Fig. 3. Specific recognition of lysoPS by GPR174.
a Electrostatic potential of the lysoPS binding surface colored from red to blue for negatively and positively charged regions. b GPR174 shows perfect shape complementarity with lysoPS. The surface of interior pocket of GPR174 is shown in gray. c Detailed interactions between GPR174 and lysoPS. d and e Concentration–response curves of GPR174 mutants treated with increasing concentrations of lysoPS in the cAMP accumulation assay (d) and the NanoBiT Gαs recruitment assay (e). All measurements were performed in three independent times, shown as mean ± SEM. Source data are provided as a Source Data file. f Concentration–response curves of GPR174/Y993.33A mutants treated with different LPs in the cAMP accumulation assay. Each data point represents mean ± SEM from three independent experiments. Source data are provided as a Source Data file.

