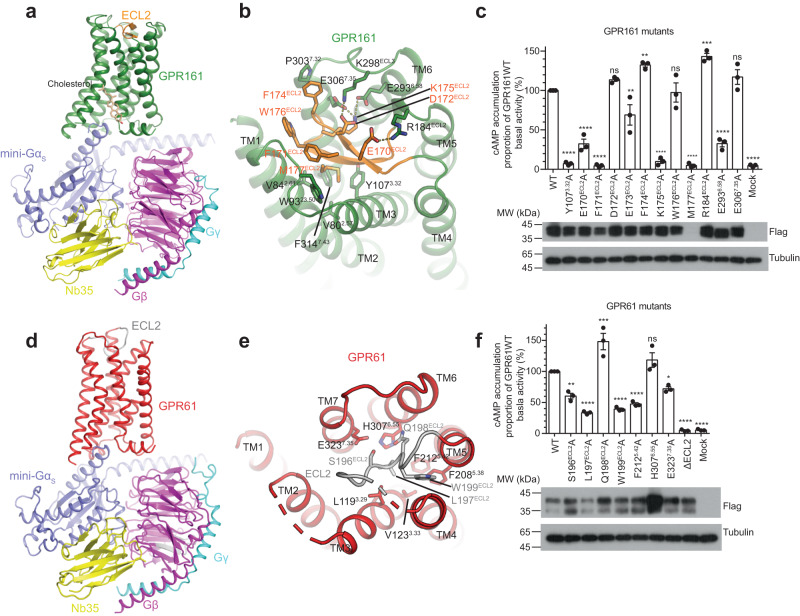
Fig. 4. ECL2 is penetrated into the orthosteric binding pocket of GPR161 and GPR61.
a and d Ribbon representation of the GPR161‒Gs (a) and GPR61‒Gs (d) complexes with ECL2 colored in orange and gray respectively. b and e Detailed interactions between ECL2 and other regions of GPR161 (b) or GPR61 (e). c and f The basal activity of GPR161 (c) or GPR61 (f) mutants determined by the cAMP assay. Bar graphs represent mean ± SEM from three independent experiments. Expression levels of mutants were determined by western blot using an anti-Flag antibody. Statistical analysis was performed using one-way ANOVA method (ns, not significant; *P < 0.1; **P < 0.01; ***P < 0.001; ****P < 0.0001). Source data are provided as a Source Data file. P values for GPR161 mutants versus WT are <0.0001, <0.0001, <0.0001, 0.5954, 0.0098, 0.0067, <0.0001, 0.9996, <0.0001, 0.0003, <0.0001, 0.3316, <0.0001 (from left to right). P values for GPR61 mutants versus WT are 0.001, <0.0001, 0.0001, <0.0001, <0.0001, 0.2203, 0.0230, <0.0001, <0.0001 (from left to right).

