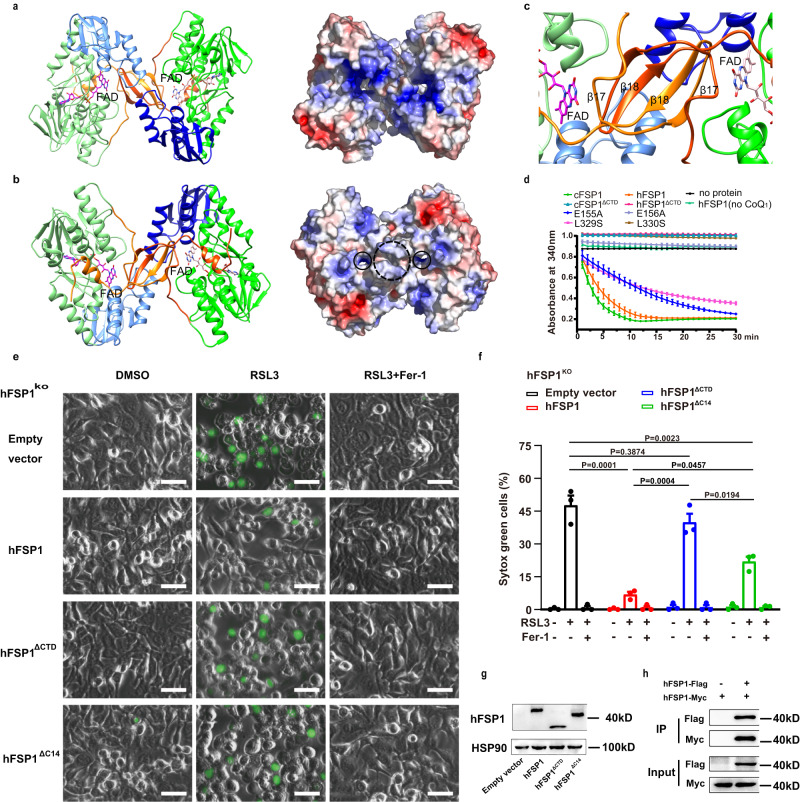
Fig. 2. The homodimer and CTD of cFSP1ΔN.
a, b The cFSP1ΔN homodimer is viewed along its crystallographic two-fold axis and from above (a) or below (b) the membrane plane. Left panels show cartoon representations of the dimeric structure, one portomer is colored as in Fig. 1b and the other one is coloured in deep green (FBD), marine (NBD), and orange red (CTD). The FAD cofactors are shown as stick representations. The right panels show the ± 5 kT/e electrostatic potential surfaces of the dimer, with surfaces of negative potential in red, positive in blue, and uncharged in white. The approximate regions for membrane association and the quinone tunnels are highlighted with black dashed and solid circles, respectively. c A close-up view of two CTDs of the dimer, which form a β-barrel-like arrangement. d NADH consumption assay (340 nm) using recombinant cFSP1 (0.5 μM) or hFSP1 (0.2 μM) as indicated. cFSP1ΔCTD, residues 1–318 in cFSP1; hFSP1ΔCTD and hFSP1ΔC14 represent residues 1–316 and 1–359 in hFSP1, respectively. e Representative images of HT1080 hFSP1KO cells transfected with the indicated hFSP1 constructs, and then treated with DMSO, RSL3 (75 nM) or with RSL3 (75 nM) and Fer-1 (2 μM) for 3 h. Dead cells were stained by Sytox Green. Scale bars, 50 µm. Representative results from one of three experiments are shown. f Cell death analysis of the cell lines depicted in (e), statistical significance of differences between two different groups were analyzed by two-sided one-way ANOVA with Tukey’s test. P values indicated (95% CI of diff., Empty vector vs hFSP1, hFSP1ΔCTD, hFSP1ΔC14: 26.03% to 55.58%, −6.98% to 22.58%, 10.96% to 40.51%; hFSP1 vs hFSP1ΔCTD, hFSP1Δ14: −47.78% to −18.23%, −29.85% to −0.30%; hFSP1ΔCTD vs hFSP1Δ14: 3.16% to 32.71%). g Western blot analysis of HT1080 hFSP1KO cells expressing the indicated proteins, which were independenty repeated twice with similar results. h Western blot analysis of Co-IP experiment using HEK293T cells co-transfected with hFSP1-Flag and hFSP1-Myc, which was perfomed only once. Data in d and f represent the mean ± s.e.m. of three experiments (n = 3). Source data are provided as a Source Data file.

