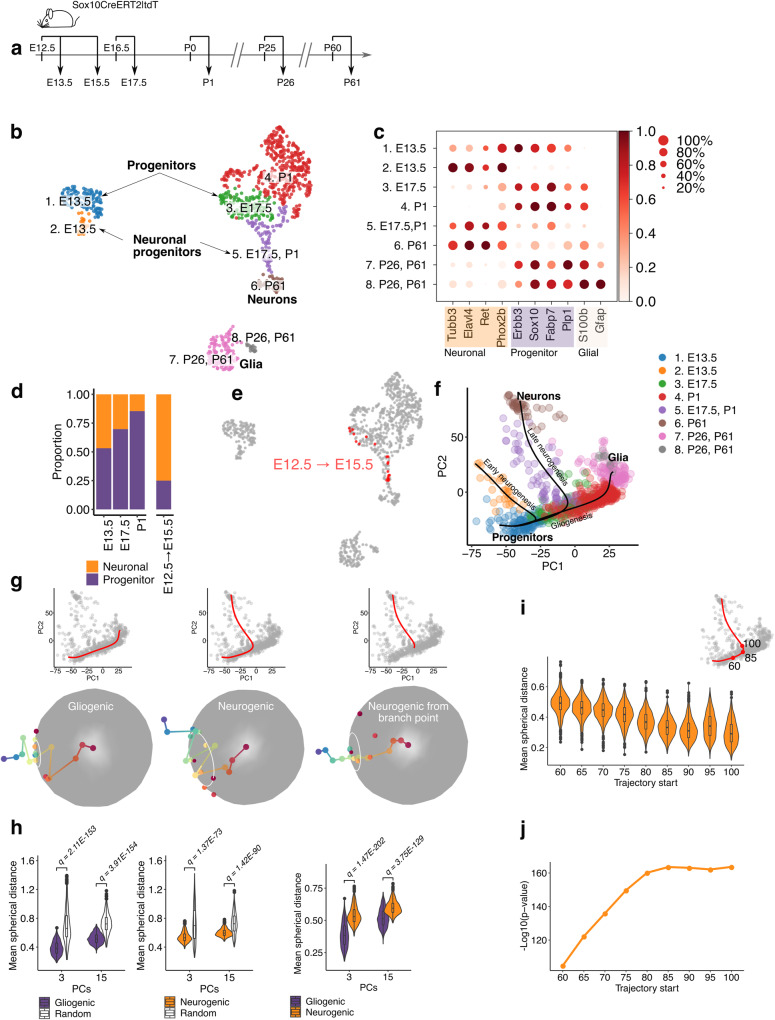
Fig. 1. scRNA-seq and TrajectoryGeometry support a branching model of ENS lineage development.
a Developmental timeline for labelling and isolation of SOX10+ ENS cells. b UMAP representation of sequenced cells (904) coloured by cluster. c Dot plot representing level of expression of neuronal, progenitor and glial markers in clusters shown in (b). The colour scale represents the mean expression level; dot size represents the percentage of cells with non-zero expression within a given cluster. d Stacked bar plot showing neuronal and progenitor fractions within the cell populations isolated at the indicated timepoints. e The UMAP of panel b showing SOX10+ cells labelled at E12.5 and isolated at E15.5. f Slingshot analysis indicating the differentiation trajectories of ENS lineages, depicted on a PCA plot. g Individual paths for the gliogenic, neurogenic and post-branching neurogenic trajectories shown on the PCA plot (top) and projected onto a sphere (bottom). The radius of the white circles indicates the mean spherical distance from the centre of the projections. h Violin plots indicating the mean spherical distance (radii of the white circles in g) for paths sampled from the gliogenic and neurogenic trajectories (purple and orange, respectively) relative to random trajectories (white) and to each other. Statistics (two-sided Wilcoxon signed-rank for comparison to random trajectories and two-sided Mann–Whitney U test for neurogenic/gliogenic comparison) calculated using 1000 paths sampled from each trajectory. i Violin plots indicating the mean spherical distance for the neurogenic trajectory starting from successively later points in pseudotime, as the branch point is approached (85 value on the neurogenic trajectory shown in the top right inset). Calculated using three principal components. In (h) and (i) the box centre represents the median, lower and upper hinges correspond to the first and third quartiles (the 25th and 75th percentiles). The whiskers extend from the hinge to the largest value no further than 1.5 * inter-quartile from the hinge. Points beyond the end of these are plotted individually. j Line graph indicating the –log10(p-value) for the significance of directionality (two-sided Wilcoxon signed-rank tests) for the neuronal trajectory relative to random trajectories, starting from successively later points in pseudotime. Calculated using three principal components. Source data are provided as Source Data files.

