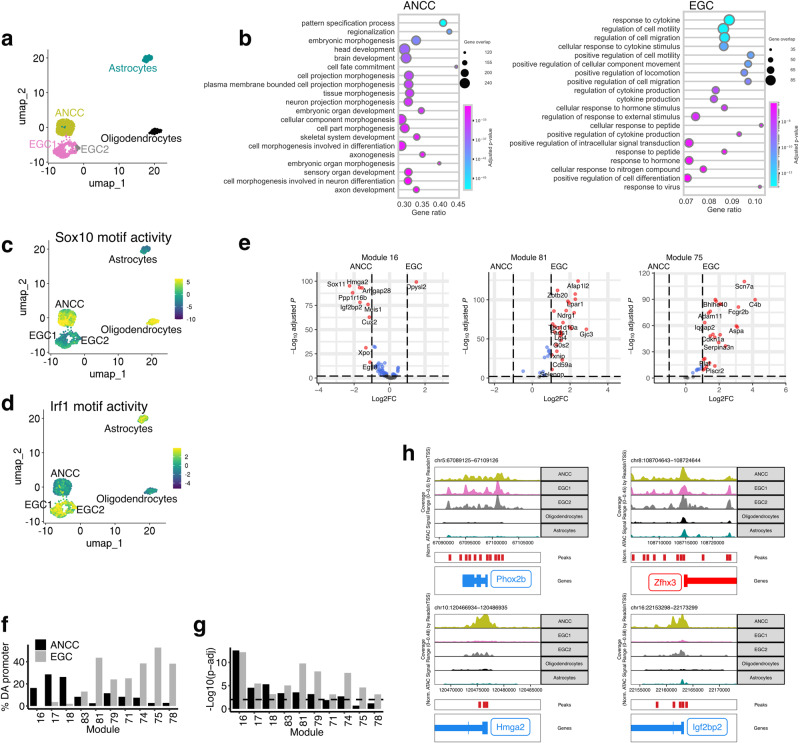
Fig. 4. Epigenetic changes along the gliogenic trajectory.
a UMAP representation of scATAC-seq for EGCs (686), ANCCs (964), cortical astrocytes (246) and cortical oligodendrocytes (214). b Dot plot showing GO terms overrepresented among genes with differentially accessible peaks (log2FC > 1 & padj <0.01) in promoter regions for ANCCs and EGCs. Dot size indicates the overlap for each term, and gene ratio indicates the fraction of genes in each term. c, d UMAPs (as in panel a) indicating SOX10 (c) and IRF1 (d) motif activity, calculated using Chromvar. e Volcano plots showing mean log2-transformed fold change (FC; x axis) and significance (−Log10(adjusted P value)) of differentially accessible (DA) genes from the indicated GMs between ANCCs and EGCs. f Bar plot showing the percentage of genes in the indicated GMs (x axis) that have at least one DA peak in their promoter region between ANCCs and EGCs. g Bar plot showing the statistical significance (hypergeometric test, −Log10(p-adj)) of enrichment of genes with at least one peak in their promoter region for the indicated GMs. Dashed line indicates p-adj = 0.01. h Track plots of ATAC signals for genes maintaining accessibility in EGCs relative to ANCCs (Phox2b, Zfhx3) and genes with reduced accessibility in EGCs relative to ANCCs (Hmga2, Igfbp2). Source data are provided as Source Data files.

