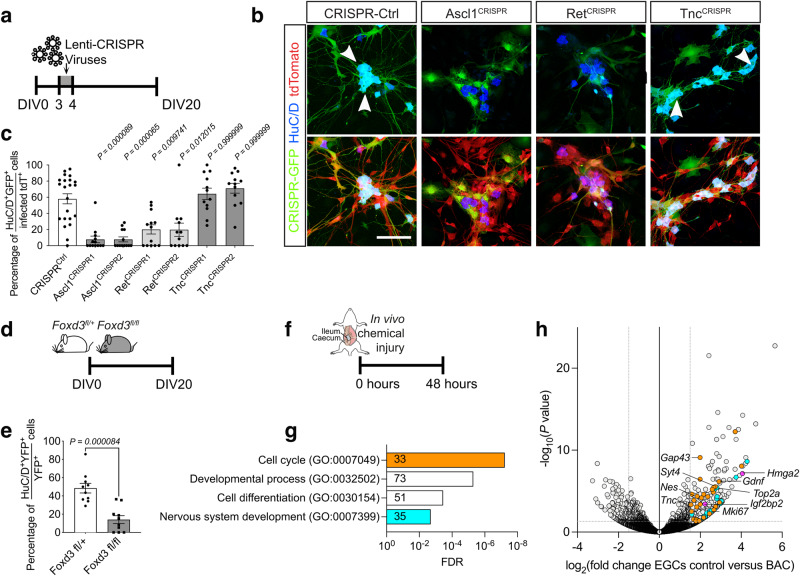
Fig. 6. Ganglioid cultures and gut injury recapitulate key features of enteric neurogenesis.
a Experimental strategy for CRISPR editing of ganglioid cultures. b Immunostaining of CRISPR-virus infected ganglioid cultures for HuC/D at DIV20. tdTomato (red) indicates cells originating from tdT+ EGCs and GFP (green) identifies CRISPR-infected cells (arrows), respectively. The genes targeted by CRISPR are indicated at the top. c Quantification of neurons following CRISPR editing of ganglioid cultures at DIV20. Data are mean ± s.e.m. (n = 22 (CRISPRCTRL), n = 13 (Ascl1CRISPR1+2, RetCRISPR1), n = 12 (RetCRISPR2, TncCRISPR1+2,) fields of view per group). Kruskal–Wallis test with Dunn’s multiple comparisons test. d Experimental strategy for the generation of ganglioid cultures established from Sox10CreERT2;Foxd3fl/+ and Sox10CreERT2;Foxd3fl/fl mice. e Quantification of neurons in cultures from Sox10CreERT2;Foxd3fl/+ and Sox10CreERT2;Foxd3fl/fl mice at DIV20. Data are mean ± s.e.m. (n = 10, fields of view per group, pooled from two independent experiments). Unpaired student’s t-test. f Experimental strategy for the collection of bulk RNA-seq data after BAC treatment. g Bar plot showing GO terms overrepresented amongst genes upregulated after BAC treatment. The number of genes upregulated per GO term are indicated in the bars. h Volcano plots showing mean log2-transformed fold change (FC; x axis) and significance (−Log10(adjusted P value)) of differentially expressed genes after BAC treatment. Cell-cycle associated genes coloured yellow, nervous system development associated genes coloured cyan and GM16 genes coloured magenta. Source data are provided as Source Data files.

