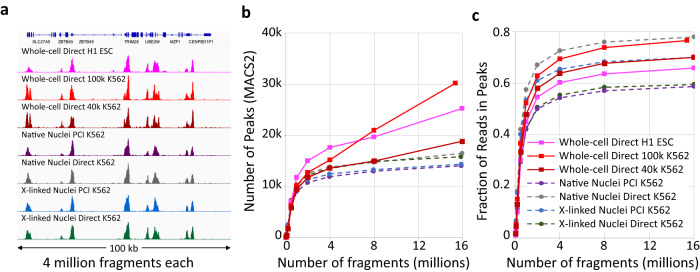
Fig. 1. High data quality from CUT&Tag-direct for whole cells.
a A comparison of H3K4me3 CUT&Tag tracks for human H1 (track 1) and K562 cells (tracks 2–7) at a representative 100-kb region of housekeeping genes. Group-autoscaled profiles for 4 million mapped fragments from each sample are shown. For Whole-cell Direct K562 samples either 100,000 (red) or 40,000 (brown) cells were used. b, c Graphs of Number of Peaks (left) and Fraction of Reads in Peaks (FRiP, right) and color-coded as in (a). Random samples of mapped fragments were drawn, mitochondrial reads were removed and MACS2 was used to call peaks using the narrow peak option. The number of peaks called for each sample is a measure of sensitivity, and FRiP is a measure of specificity calculated for each sampling from 50,000 to 16 million fragments. Nuclei data are from a previously described experiment69. Source data are provided as a Source Data file.

