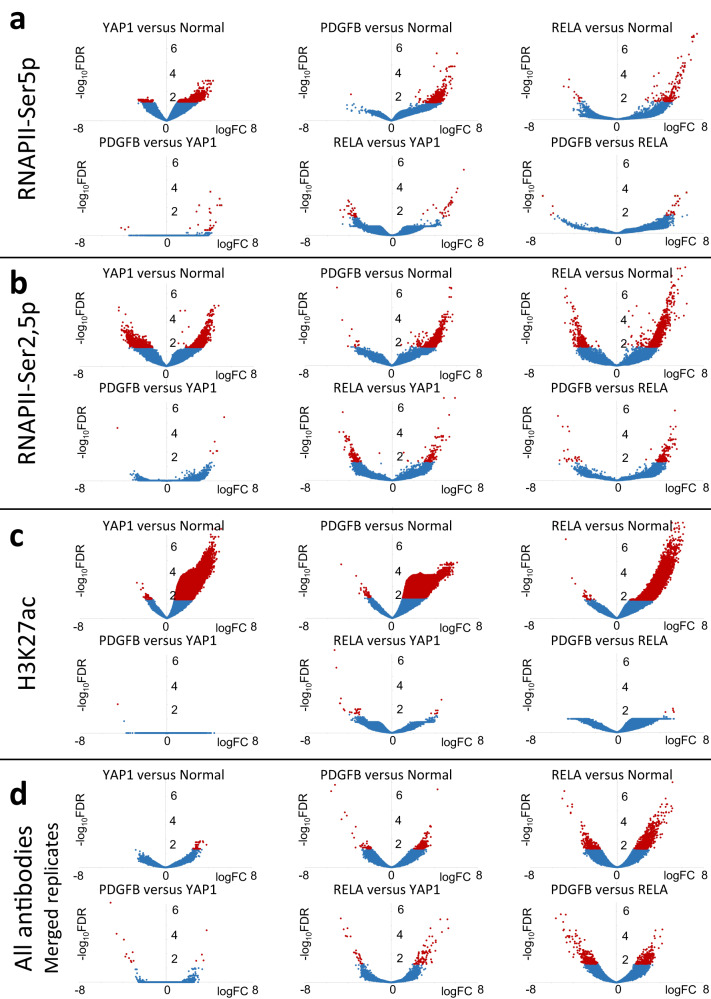
Fig. 4. Volcano plots for pairwise comparisons between FFPE-CUTAC samples.
The Degust server (https://degust.erc.monash.edu/) was used with Voom/Limma defaults to generate volcano plots, where replicates consisted of a mix of samples run in parallel or on different days on FFPE slides from 8 different brain samples (3 Normal, 3 YAP1, 1 PDGFB, 1 RELA). Input for each sample was 10–25% of an FFPE slide, which ranged from ~50,000-100,000 cells per 10-micron section. a Comparisons based on RNAPII-Ser5p using average normalized counts per base-pair for each cCRE, applying the Empirical Bayes Voom/Limma algorithm for pairwise comparisons using the other datasets as pseudo-replicates to increase statistical power. Replicate numbers: Normal: 13; YAP1: 14, PDGFB: 3; RELA: 2. b Same as (a) for RNAPII-Ser2,5p. Replicate numbers: Normal: 5; YAP1: 6; PDGFB: 3; RELA: 3. c Same as (a) for H3K27ac. Replicate numbers: Normal: 10; YAP1: 12; PDGFB: 5; RELA: 7. d Datasets from multiple FFPE-CUTAC experiments for each antibody (RNAPII-Ser5p, RNAPII-Ser2,5p or H3K27ac) or antibody combination (RNAPII-Ser5p + RNAPII-Ser2,5p) were merged, then down-sampled to the same number of mapped fragments for each genotype. These 16 datasets (4 antibodies x 4 genotypes) were compared against each other with Voom/Limma using the other 14 datasets as pseudo-replicates. Top hits FDR < 0.05 (red) are listed in Supplementary Data 5.

