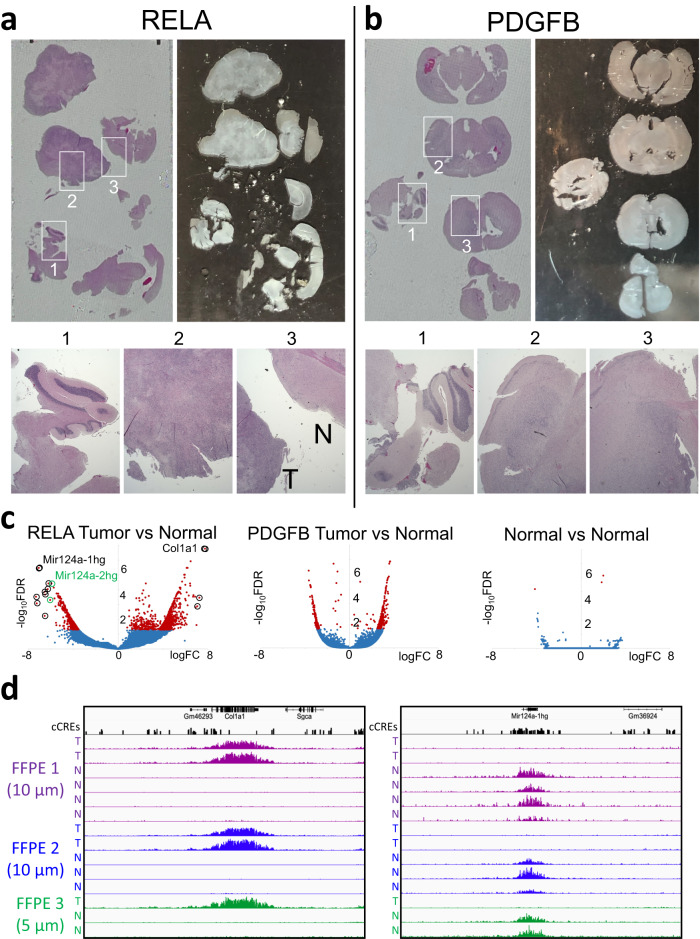
Fig. 6. FFPE-CUTAC distinguishes tumor from normal tissue within the same FFPE section.
a RELA drives well-defined ependymomas where dissection following tagmentation and transfer of whole sections to PCR tubes after RNAPII-Ser5p FFPE-CUTAC post-tagmentation successfully separated tumor from normal tissue with volcano plot results similar to that for RELA versus Normal brains (Fig. 4). b In contrast, PDGFB-driven gliomas are relatively diffuse, and separation of sections post-tagmentation resulted in fewer significant target cCREs. c Left: Volcano plot for FFPE Slide 1 (2 tumor 4 normal sections) using two other slides with 3 tumor and 5 normal sections as pseudo-replicates. Top RELA FFPE hits based on FDR < 0.01 and greatest fold-change are circled and tabulated in (Supplementary Data 6). Middle: Volcano plot for a PDGFB slide (3 tumor, 4 normal). Right: Volcano plot for a normal brain (5 versus 5 replicates). Replicate tracks for the two top upregulated (Col1A1) and down-regulated (Mir124a-1hg) loci are shown, group-autoscaled, where red marks dots with FDR < 0.05. d Tracks for the RELA Tumor-versus-Normal experiments are shown for Col1a1 (left) and Mir124a-1hg (right) color-coded and group-autoscaled for each replicate FFPE slide dissected.

