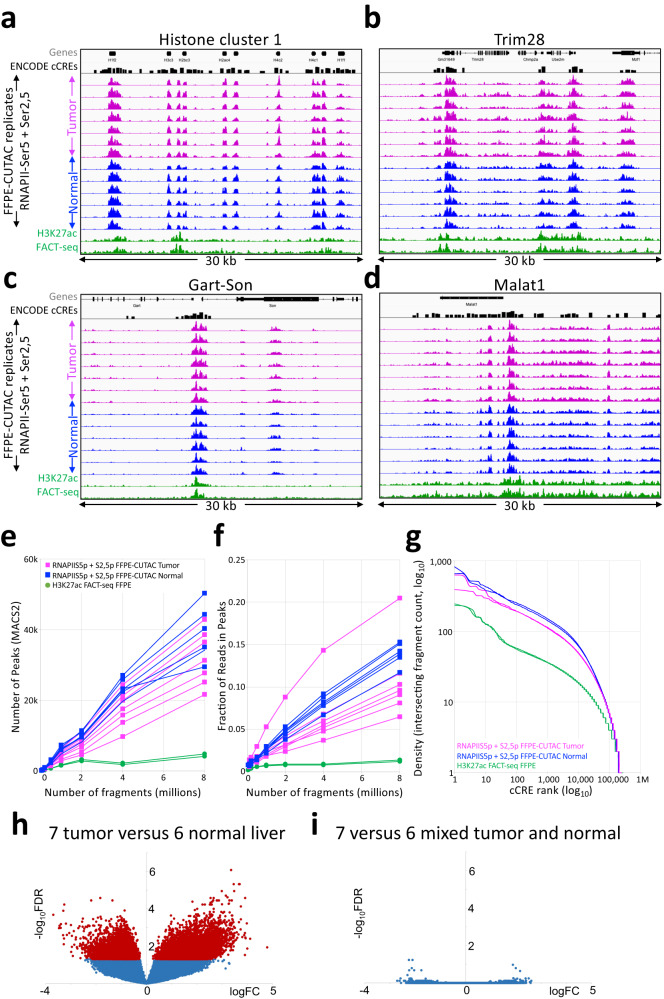
Fig. 7. FFPE-CUTAC produces high-quality data from liver FFPEs.
a–d Representative tracks of liver tumor and normal liver FFPE-CUTAC and FACT-seq samples at the housekeeping gene regions depicted in Fig. 3. A track for Candidate cis-Regulatory Elements (cCREs) from the ENCODE project is shown above the data tracks, which are autoscaled for clarity. e, f Number of peaks and Fraction of Reads in Peaks (FRiP) called using MACS2 on samples containing the indicated number of cells for 7 liver tumor (magenta), 6 normal liver (blue) and 2 normal liver FACT-seq (green) samples. g Cumulative log10 plots of normalized counts intersecting cCREs versus log10 rank for representative liver samples, where red marks dots with FDR < 0.05. h Voom/Limma volcano plot for the 7 liver tumors versus 6 normal liver samples. i Control volcano plot in which three liver tumor samples and 3 normal livers were exchanged for Voom/Limma analysis. Rank-ordered cCREs based on averages are tabulated in Supplementary Data 7. Source data are provided as a Source Data file.

