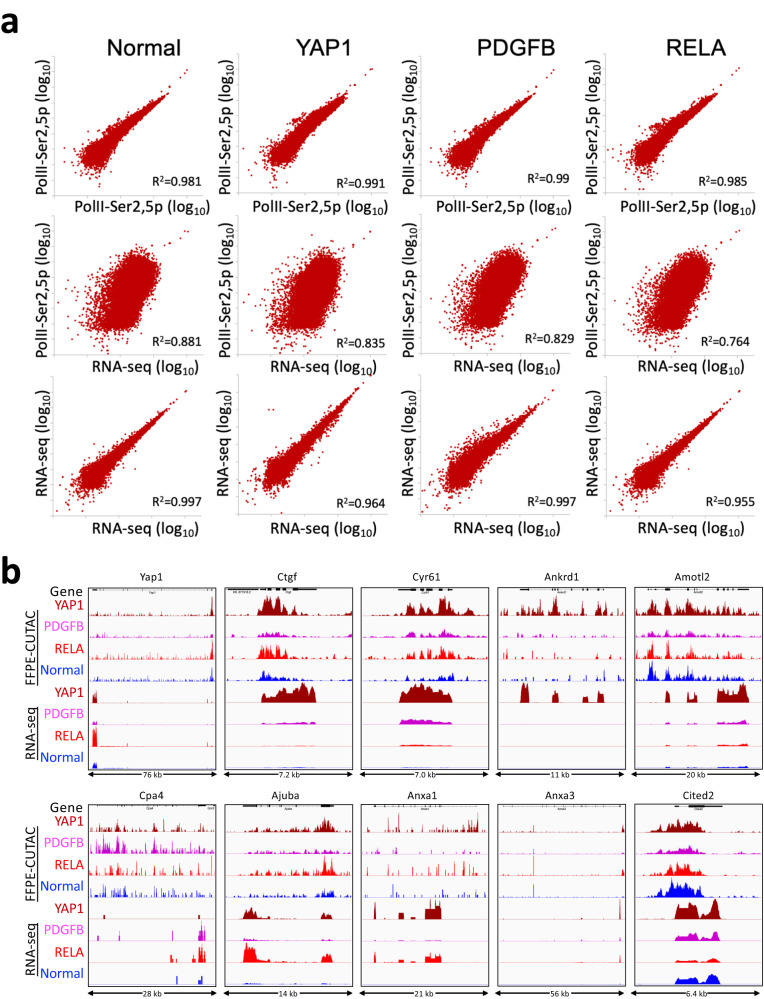
Fig. 8. Comparisons between FFPE-CUTAC and RNA-seq.
a Top panels: Scatterplots of representative FFPE-CUTAC replicate samples from RNAPII-Ser2,5p for normal brain and the three tumors. Middle panels: Scatterplots of comparisons between the RNAPII-Ser2,5p sample and the corresponding RNA-seq dataset. Lower panel: Scatterplots of RNA-seq datasets used in the comparisons. b Comparisons between FFPE-CUTAC and RNA-seq over Yap1 and previously reported Yap1 direct targets. Tracks were group-autoscaled within modalities. Rank-ordered pairwise comparisons are listed in Supplementary Data 4.

